Baltic Dry Index (BDI) and Its Calculation
The Baltic Dry Index tracks the daily cost of hiring dry bulk ships. The formula step by step, reference ships, a worked example, its history since 1985 and how to read it.
The Baltic Dry Index (BDI) is the daily benchmark of what it costs to hire dry bulk ships, published by the Baltic Exchange in London on every business day. Since 1 March 2018 it has been a weighted sum of time charter averages, 40% Capesize, 30% Panamax and 30% Supramax, multiplied by 0.1.[1][2] It tracks the cost of hiring ships on set routes, and contains neither the quantity nor the price of the cargo they carry.
What the Index Measures
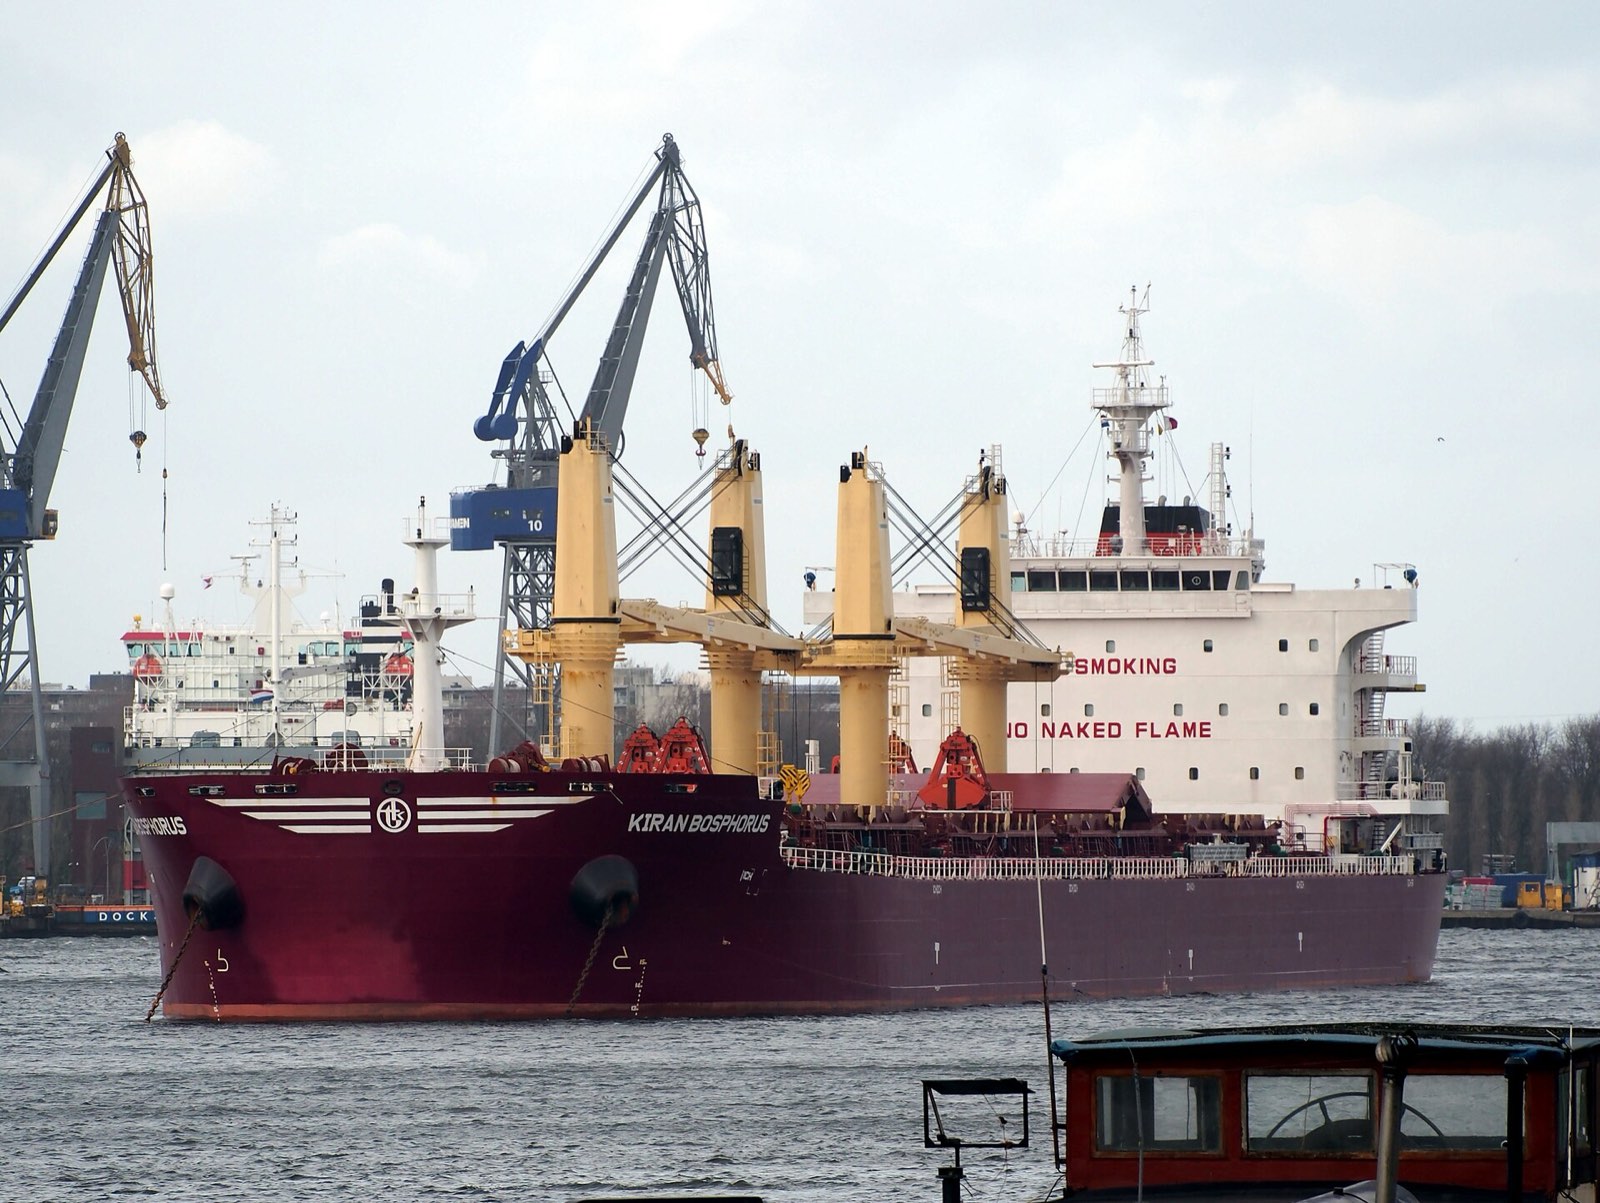
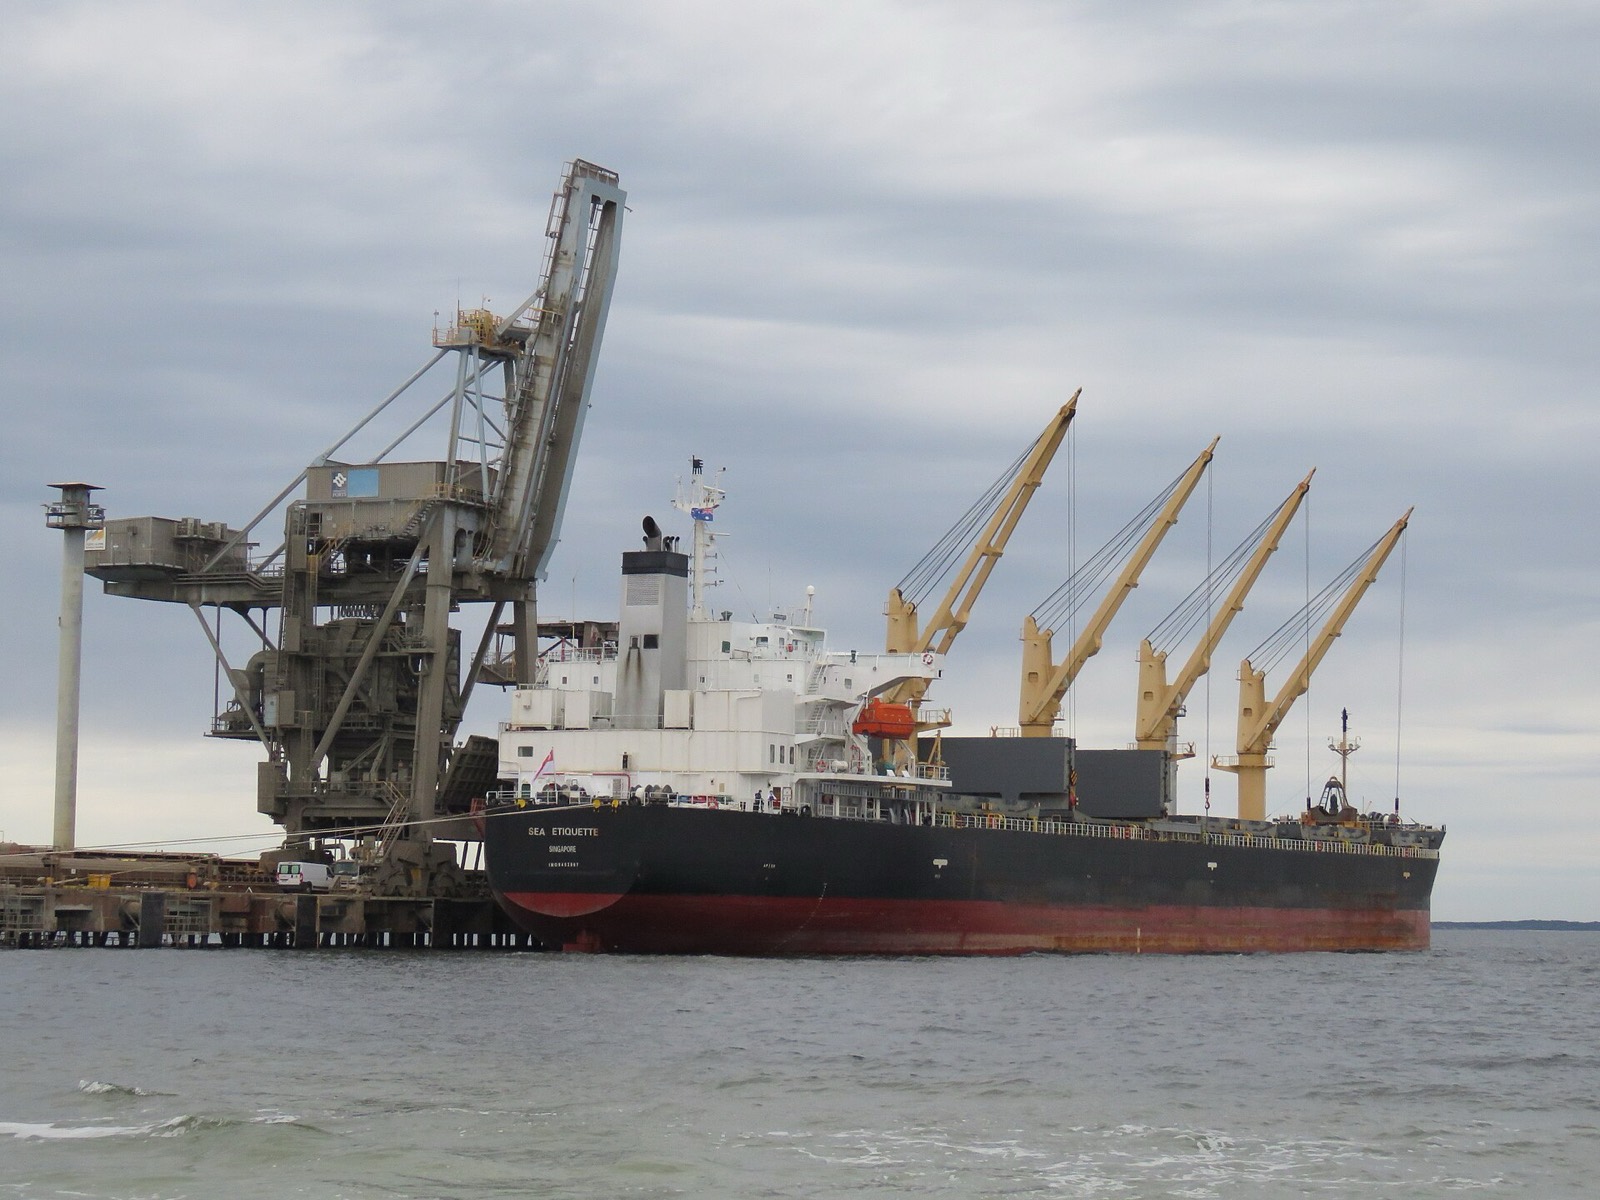
Dry bulk ships carry unpackaged commodities such as iron ore, coal, grain, bauxite and fertiliser. Most of them run no fixed schedule and go wherever the next cargo is, with each employment negotiated separately between owner and charterer. There is no published tariff, so the market relies on a shared benchmark.
The input to the BDI is time charter earnings in dollars per day. Under a time charter the charterer pays for fuel and port costs, so these are excluded. A rise in bunker prices can lift voyage rates without moving the index by the same proportion. The freight guide works through the link between voyage rates and hire with an example.

How the BDI Is Calculated
A panel of international shipbrokers submits assessments for defined routes each business day. These feed a time charter average per ship type, stated in dollars per day. The three averages are then weighted 40, 30 and 30, and the result is multiplied by 0.1 to give index points.[1]
| Ship type | Reference size (dwt) | Routes | Weight | Typical cargo |
|---|---|---|---|---|
| Capesize | 180,000 | 5 | 40% | Iron ore, coal |
| Panamax | 82,500 | 5 | 30% | Coal, grain |
| Supramax | 58,328 | 10 | 30% | Grain, fertiliser, cement, smaller parcels |
Source: Wikipedia, Baltic Dry Index. Reference ships and route baskets can change over time; the Baltic Exchange's methodology documents carry the current definitions.[1]
In the following sum the daily earnings are assumptions chosen to demonstrate the formula. They do not represent any actual market day.
| Ship type | Assumed average (USD/day) | Weight | Contribution |
|---|---|---|---|
| Capesize | 20,000 | 0.40 | 8,000 |
| Panamax | 12,000 | 0.30 | 3,600 |
| Supramax | 11,000 | 0.30 | 3,300 |
| Weighted average | 14,900 | ||
| BDI (times 0.1) | 1,490 |
The weights are visible in the arithmetic. A USD 5,000 rise in the Capesize average adds 200 points, while the same move in Supramax adds 150. Capesize earnings are also the most volatile of the three, so that segment drives much of the day-to-day movement.
History of the Index
The Exchange traces its origins to merchants and ship captains meeting in a London coffee house in 1744. Its first daily freight index, the Baltic Freight Index, appeared in January 1985, and the Baltic Dry Index took over on 1 November 1999.[1]
The composition has been revised more than once. Until 2018, four ship types carried equal weight. On 1 March 2018 Handysize was removed and Capesize raised to 40%.[1][2] Handysize continues as a separate published index, and formulas online that average four ship types describe the earlier period.
The record high stands at 11,793 points on 20 May 2008, and the record low at 290 on 10 February 2016.[1] The distance between those two dates says a great deal about supply in this market. Ships ordered during the boom kept arriving long after demand had weakened, and the surplus depressed earnings for years.
Use as an Economic Indicator
Financial journalists often cite the BDI as a reading on industrial demand, and two features explain the appeal. Dry cargo is the raw material of steel, power and food production, so demand moves with output plans. Ship supply, meanwhile, is close to fixed in the short run because a new vessel takes years to deliver. Small changes in demand therefore produce large changes in price.
Three limits apply. Supply can dominate: when the fleet is growing fast, a falling index may reflect surplus ships more than weak demand. Composition matters too, as the Capesize weighting ties the index closely to Chinese iron ore imports and to loadings in Brazil and Australia, and port congestion or weather can temporarily remove ships from the market. Coverage is also narrow. Container, tanker and gas shipping are all excluded, and since manufactured goods move largely in containers, the index cannot speak for world trade as a whole.
The sub-indices add useful detail. A rise confined to Capesize probably comes from ore and coal flows, whereas Panamax and Supramax rising alongside it suggests demand across a wider range of cargoes.
Risk Management and Other Benchmarks
Owners and cargo interests mainly manage freight risk through forward freight agreements (FFAs), which settle in cash against Baltic route and time charter assessments without any ship changing hands. One of the reasons given for the 2018 change was to align the index with the segments where derivatives trading is concentrated.[2] Anyone assessing a particular ship's earnings looks at the relevant route or type value, leaving the composite aside.
Other sectors have their own measures. The Baltic Exchange publishes dirty and clean tanker indices (BDTI, BCTI), while containers are followed through Drewry's WCI, SCFI and FBX, all produced by other organisations. The maritime transport guide sets out the main ship types.
The Market Role of Each Ship Type
The three components stand for different parts of the same market. Capesizes were historically too large for the old Panama Canal locks and took their name from sailing around the Cape of Good Hope or Cape Horn. Most have no cranes of their own and depend on deep-water, well-equipped ore and coal terminals. Because they serve a few large cargo flows, changes in demand reach their earnings quickly.
Panamaxes are named after the old canal dimensions and are the main carriers of coal and grain. Supramaxes usually have their own gear, which opens up ports with limited shore equipment and a wider choice of cargoes. That variety can give them a steadier earnings profile than Capesizes.
How Supply and Demand Reach the Price
Freight volatility comes from the shape of the supply curve. When demand is low, idle and slow-steaming ships hold rates close to owners' operating costs. As demand rises, spare capacity disappears, ships speed up and the last available vessels come into use. Past that point even a small rise in demand can cause a sharp jump in rates.
Consider an assumed region with 100 ships, 95 of them employed. If demand rises to the equivalent of 96 ships, charterers compete for what remains but still have options. Once it reaches 101, some cargoes cannot find a ship at all, and charterers bid up to protect their schedules. A rise in demand of about 5% can then produce a far larger move in price. The numbers serve only to show the mechanism.
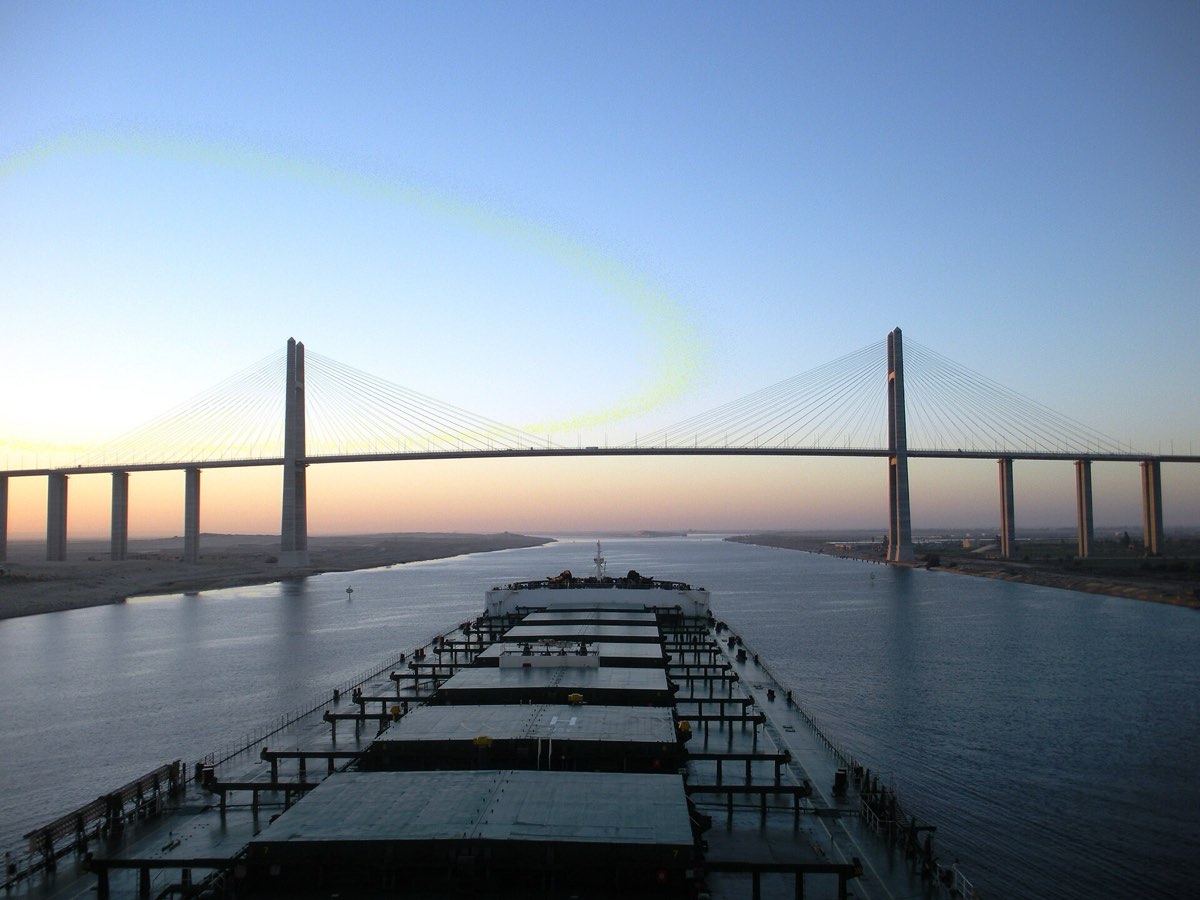
Port queues and longer routes pull in the same direction. A ship waiting off a congested port or sailing around the Cape instead of through Suez reduces the capacity actually available. Ton-miles capture this effect, and a rising index may owe as much to longer voyages as to extra cargo.
Link to Voyage Economics
Baltic time charter values show the daily amount paid by a charterer. On a voyage charter the owner receives freight and pays for fuel and port costs. Both express the same market and can be converted into one another. Assume a ship burns 30 tonnes a day on a 40-day voyage, or 1,200 tonnes in all. A USD 100 rise in the bunker price adds USD 120,000 to voyage costs, the equivalent of USD 3,000 a day, and freight must rise by that amount to keep daily earnings level.
This is why voyage freight can climb with fuel while time charter earnings stay flat. Slow steaming belongs to the same relationship: expensive fuel leads ships to slow down, the fleet then carries less, and effective supply tightens. The BDI records these effects only as far as they reach earnings.
Frequently asked questions
What is the Baltic Dry Index?
The Baltic Dry Index (BDI) is the daily benchmark of what it costs to hire dry bulk ships, published by the Baltic Exchange in London on every business day.
How is the Baltic Dry Index calculated?
Brokers assess hire rates on set routes, which give a daily time charter average per ship type. The averages are weighted 40% Capesize, 30% Panamax and 30% Supramax, and the result is multiplied by 0.1.
What does a rising BDI mean?
Dry bulk ships are earning more per day. That can reflect stronger demand for ore, coal and grain, but also fewer available ships or longer voyages, so the sub-indices need checking.
Why is it called "Baltic"?
The name comes from the Baltic Exchange, whose origins lie in a London coffee house where Baltic trade was discussed. The index has no direct link with routes in the Baltic Sea.
Does the BDI include fuel prices?
Not directly. Its input is time charter earnings, which exclude voyage costs. Bunker prices can still influence owners' earnings indirectly.
Does it show container freight rates?
No. It covers dry bulk ships only.
Sources
- Wikipedia. Baltic Dry Index (secondary source).
- FreightWaves. Baltic Dry Index Re-weighted for Futures Investors, February 2018.