Brent Crude and How It Differs from WTI
Brent is the North Sea based crude benchmark. Who owns the field and who runs the benchmark, how the basket grew, how the price forms, and what really separates it from WTI.
Brent is the international crude oil benchmark built on North Sea grades and freight-adjusted US cargoes. A 2011 study by Bassam Fattouh of the Oxford Institute for Energy Studies found that about 70% of international oil trade was priced directly or indirectly off the Brent complex.[1] The Brent price quoted in the news is usually the futures contract on ICE in London. WTI, its main rival, rests on US inland crude delivered at Cushing, Oklahoma. The Brent field that gave it the name, a Shell and Esso venture, is being dismantled, and the benchmark itself has no owner.
The Name and the Field
The field lies in the East Shetland Basin, north-east of the Shetland Islands. A Shell and Esso joint venture found it in 1971, at a time when Shell was naming its UK fields after seabirds, and Brent took its name from the brent goose.[2] Production began in 1976 and peaked at 504,000 barrels a day in 1982.[3]
Decommissioning is now well advanced. The topsides of Delta came off in 2017, Bravo in 2019 and Alpha in 2020, and on 9 July 2024 the vessel Pioneering Spirit lifted the 31,000-tonne Charlie topsides in one piece.[4] The oil behind today's Brent price therefore comes from somewhere else.
Who owns Brent has two answers. When decommissioning began the field was a venture operated by Shell, split 50% to Shell and 50% to Esso, ExxonMobil's UK arm.[12] The benchmark belongs to nobody, since it measures cargoes bought and sold by many companies. ICE runs the futures contract and Platts publishes Dated Brent.

Why Brent Became the Benchmark
Volume alone does not make a benchmark. The North Sea sits close to European and US refineries, and because the oil loads onto ships it can go wherever the price is best. Ownership and law matter more. Output shared among many companies under British oversight is harder to squeeze than crude from a single Gulf seller. UK tax rules introduced in 1979 also gave companies a reason to trade and re-trade cargoes on the spot market, which built up liquidity.[1]
The system dates from the collapse of OPEC's administered prices. Mexico's PEMEX adopted market-related pricing first, in 1986, and by 1988 it was the main method of pricing crude.[1] Most cargoes today are priced by formula:
Cargo price = benchmark price ± quality and location differential
Take an invented case where Dated Brent is $80 and the cargo differential is minus $1.50. The price is $78.50 a barrel, and on a standard 700,000-barrel cargo each $1 move in the benchmark changes the value by $700,000.
A Growing Basket
As output falls, too few cargoes make a benchmark easy to manipulate, so the pool behind Brent has been widened several times. When Brent system output slid from 885,000 barrels a day in 1986 to 366,000 in 1990, the Brent and Ninian systems were merged to create Brent Blend.[1]
| Year | Change | Result |
|---|---|---|
| 1990 | Brent and Ninian commingled | Brent Blend |
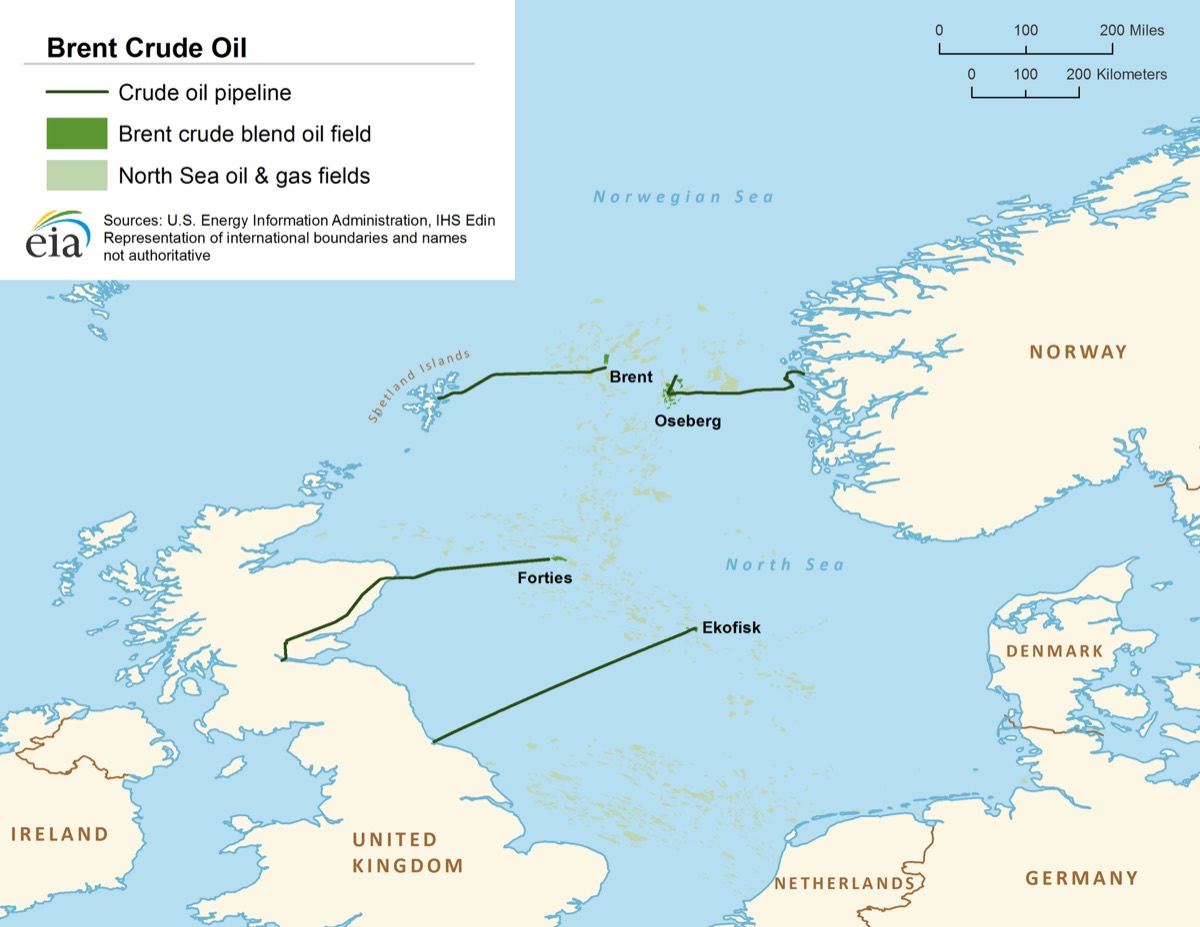
| 2002 | Platts adds Forties and Oseberg | BFO |
| 2007 | Ekofisk added | BFOE |
| 2018 | Troll added | BFOET, about 29% more volume on 2016 loadings |
| 2023 | WTI Midland added on a freight-adjusted basis | Eligible volume roughly doubled |
Sources: Fattouh; EIA; ICE; Quantum Commodity Intelligence.[1][3][5][6]
BFOE loadings fell from over 1.4 million barrels a day in 2006 to 948,000 in 2016.[3] WTI Midland, the first grade from outside the North Sea, was the answer to that decline. Its price is brought to a North Sea basis with a freight adjustment, and the assessed cargo size rose from 600,000 to 700,000 barrels.[5][6]
Quality and the Marginal Cargo
The grades are not the same, and a seller will generally deliver whichever is cheapest, so the lowest-value grade tends to set the price. The Buzzard field shows what that can do. Its start-up in 2007 fed a heavier, more sulphurous stream into Forties.
| Grade | API gravity | Sulphur (% by weight) |
|---|---|---|
| Brent | 38.1 | 0.42 |
| Forties before Buzzard | 44.1 | 0.19 |
| Buzzard | 32.6 | 1.44 |
| Oseberg | 37.7 | 0.23 |
| Ekofisk | 37.5 | 0.23 |
Source: Bossley (2007), as cited by Fattouh.[1] API gravity is explained in the article on petroleum.
Forties became the least valuable grade in the basket. In response Platts introduced a sulphur de-escalator in July 2007, which at the time took 60 cents a barrel off for each 0.10% of sulphur above a 0.60% base.[1]
Layers of the Brent Complex
"Brent" covers several connected markets that grew up piece by piece as traders needed them.[1]
| Layer | What it is | What it does |
|---|---|---|
| Dated Brent | Assessed price of a physical cargo with a specific loading date | Main reference for physical cargoes |
| Forward Brent (21-day BFOE) | Forward contract naming a month, without a loading date | Sets the price level |
| ICE Brent futures | Standard 1,000-barrel exchange contract | Hedging and investment |
| EFP | Exchange of a futures position for a physical one | Links futures and physical |
| CFD | Swap on the gap between Dated and forward Brent | Hedges basis risk |
| DFL | Swap on the gap between Dated Brent and front-month ICE futures | Hedges physical against futures |
Source: Fattouh.[1]
Dated Brent is assessed daily by the price reporting agency Platts. At the time of Fattouh's 2011 account it covered cargoes loading 10 to 21 days ahead. The forward market grew out of the older 15-day Brent contract, and it fixes the delivery month while leaving the exact day open until later.[1]
ICE Brent futures began on the International Petroleum Exchange in London in June 1988.[1] One lot is 1,000 barrels and the minimum price move is $0.01 a barrel, or $10 a lot. A position can be converted to physical through EFP or left to cash settle at expiry against the ICE Brent Index.[7] Because that index is built from forward market trades, the Brent future converges on forward Brent at expiry and not on a spot price.[1] Trading dwarfs the physical base: in 2010 average daily volume topped 400 million barrels, more than five times world oil production.[1]
A Hedging Example
Suppose a refiner buys a 700,000-barrel cargo priced on Dated Brent. It can sell 700 lots of ICE Brent futures against the price risk, yet that leaves it exposed if the gap between futures and Dated moves. CFDs and DFLs exist to cover this basis risk, which is why real hedges usually combine positions across several layers.
Brent Compared with WTI
The two benchmarks are close in quality. They part ways on logistics and contract design.
| Feature | Brent | WTI |
|---|---|---|
| Underlying | North Sea grades and WTI Midland | US inland streams |
| Exchange | ICE Futures Europe | NYMEX (CME Group) |
| Settlement | EFP or cash against an index | Physical delivery at Cushing, Oklahoma |
| Contract | 1,000 barrels | 1,000 barrels |
| API gravity | 38.1 for the Brent grade | 37 to 42 |
| Sulphur | 0.42% for the Brent grade | Under 0.42% |
| Main reach | Europe, Africa and the Atlantic basin | North America |
Sources: ICE; West Texas Intermediate entry; Fattouh.[1][7][8]

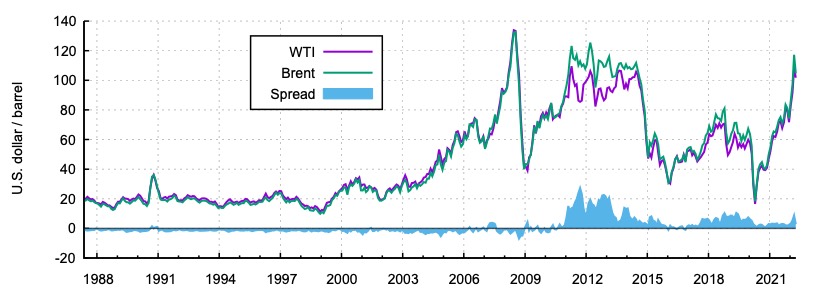
Quality does not explain the spread. WTI generally traded above Brent until the shale boom, when crude piling up at Cushing could not easily reach the Gulf Coast. In February 2011 WTI stood at about $85 and Brent at about $103. Reversing the Seaway pipeline in June 2012 did not close the gap straight away, and Brent stayed $10 to $20 higher until June 2013.[8] Lifting the US crude export ban in December 2015 helped narrow it further.[9]
20 April 2020
The contract difference showed most clearly on 20 April 2020. With demand collapsing in the pandemic and storage at Cushing almost full, the expiring WTI May contract settled at minus $37.63 a barrel. Brent closed that day at $25.57.[10] Holders of WTI faced physical delivery at an inland hub with nowhere to put the oil. Brent rests on waterborne cargoes with far more storage options.
What Moves the Price
On the supply side, producer decisions, inventories, outages from war or sanctions and field maintenance all count. On the demand side, the drivers are economic growth, transport and refining margins. Since oil is priced in dollars, currency moves change the cost for buyers paying in other money. With futures volume so far above physical trade, prices can also drift from the physical balance in the short term.
Other Benchmarks
Dubai and Oman are the references for Gulf sour crude going to Asia. The destination generally decides the benchmark, so a Gulf producer may price Asian sales on Dubai and Oman and European sales on Brent.[1] The role of producer decisions is covered in the article on OPEC.
Brent and Marine Fuel Costs
Bunker prices form in their own market and do not follow Brent at a fixed ratio. Crude is still the main input for fuel oil and gas oil, however, so Brent gives an early signal of where bunker costs may be heading. The closure of the Strait of Hormuz at the mouth of the Persian Gulf in late February 2026 was a recent supply shock of this kind.[11] Because the crack between crude and fuel keeps moving, a hedge done in Brent does not always match the fuel bill. See the articles on protection from fluctuating fuel prices and the Fuel Oil and Gas Oil page.
Frequently asked questions
What is Brent crude?
Brent is the international crude oil benchmark built on North Sea grades and freight-adjusted US cargoes.
Who owns Brent crude?
When decommissioning began, the Brent field was a 50:50 venture between Shell, the operator, and Esso, ExxonMobil's UK arm. The benchmark has no owner. ICE runs the futures contract and Platts publishes Dated Brent.
Where does Brent crude come from?
The original field is being dismantled. The benchmark now rests on the North Sea grades Forties, Oseberg, Ekofisk and Troll, plus freight-adjusted WTI Midland cargoes.
How many litres are in a barrel of Brent?
About 159. One ICE contract of 1,000 barrels is about 159 cubic metres.
Which is more expensive, Brent or WTI?
Brent has mostly traded above WTI since 2011. The gap owes more to Cushing logistics and freight than to quality.
What is the difference between Dated Brent and ICE Brent?
Dated Brent is the assessed price of a physical cargo with a set loading date. ICE Brent is the 1,000-barrel futures contract traded in London.
Sources
- Fattouh, B. An Anatomy of the Crude Oil Pricing System. Oxford Institute for Energy Studies, WPM 40, January 2011.
- GEO ExPro. The Class of '71. EIA gives the discovery year as 1972.
- US Energy Information Administration (EIA). Another Type of Crude Oil to Be Included in Calculation of the Brent Price Benchmark. Today in Energy, 10 March 2017.
- Oil & Gas Journal. Shell Continues Brent Oil Field Platform Decommissioning, 15 July 2024.
- ICE. Midland into Brent: A Practical Trading Guide, May 2023.
- Quantum Commodity Intelligence. WTI Midland Makes Immediate Impact on Dated Brent, 6 June 2023.
- ICE. Brent Crude Futures, contract specification.
- Wikipedia. West Texas Intermediate. Used as a secondary source.
- Petroleum Science, 2019, Issue 6. Abstract of an article on the WTI and Brent spread.
- Dawn. Oil Crashes, Ends Negative for the First Time in History, 21 April 2020.
- Energy Institute. Statistical Review of World Energy 2026, as reported by DieselNet, July 2026.
- Offshore Technology. Brent Field Decommissioning, North Sea, 30 July 2015.