Petroleum Formation, Production and Transport
What crude oil contains, how it forms and is graded, how much a field gives up, what a refinery makes of a barrel, and how it moves by sea.
Petroleum is a naturally occurring mixture of hydrocarbons trapped in rock. It forms over millions of years as plankton and algae buried in ancient sea and lake beds are altered by heat and pressure. Wells bring it to the surface, tankers and pipelines carry it to refineries, and refineries turn it into gasoline, diesel, jet fuel, marine fuel, asphalt and petrochemical feedstock. World consumption in 2025 was somewhere between 103 and 105 million barrels a day depending on who is counting, and the United States was the largest producer at 13.6 million.[1][2][3][4]
The word is Medieval Latin for rock oil, from petra and oleum. People used it long before anyone refined it. Sumerians were building boats with bitumen more than 4,300 years ago, and wells were being sunk with bamboo in China by 347 CE. The modern industry dates from the 1850s, when demand for lamp oil made kerosene worth distilling at scale. Ignacy Łukasiewicz worked out how to distil it in what is now Poland, and Edwin Drake's well in Pennsylvania came in during 1859.[5]
What Crude Oil Contains
Two crudes can look nothing alike, one a pale liquid and the other close to tar, yet their elemental make-up barely differs. By weight, crude oil is 83 to 85% carbon and 10 to 14% hydrogen. Sulphur ranges from 0.05 to 6%, nitrogen from 0.1 to 2%, and oxygen from 0.05 to 1.5%. Metals, among them iron, nickel, copper and vanadium, stay below 0.1%.[5]
The difference lies in how those atoms are arranged. Four families of molecules are usually distinguished.
| Family | Structure | Average share by weight | Range |
|---|---|---|---|
| Paraffins (alkanes) | Straight or branched chains | 30% | 15 to 60% |
| Naphthenes | Saturated rings | 49% | 30 to 60% |
| Aromatics | Benzene rings | 15% | 3 to 30% |
| Asphaltics | Very large, heavy molecules | 6% | The remainder |
Source: values compiled in the Petroleum entry.[5]
At surface conditions, methane through butane are gases, while pentane and heavier compounds are liquids or solids. Pressure underground keeps some of that gas dissolved in the oil, and it comes out of solution on the way up as associated gas. Gas fields do the opposite. Heavier components that are gaseous in the reservoir condense at the surface into a very light liquid called condensate, which is why production statistics so often read "crude oil and condensate".
How Oil Forms and Accumulates
The starting point is organic matter buried in oxygen-poor mud, where bacteria cannot fully break it down. Down to roughly 1 km and about 50 °C it turns into kerogen, a waxy solid. Deeper burial brings catagenesis, in which kerogen cracks into liquid and gaseous hydrocarbons. Geologists call the temperature range that yields liquids the oil window. Below it the material stays as kerogen, and above it the oil itself cracks into natural gas.[5]
A field needs three things to line up: a source rock buried deep enough to cook, a porous and permeable reservoir rock to hold what migrates out of it, and an impermeable seal on top.[5] Oil is lighter than water and rock, so it keeps moving upward until something stops it. Without a seal it reaches the surface as a natural seep.
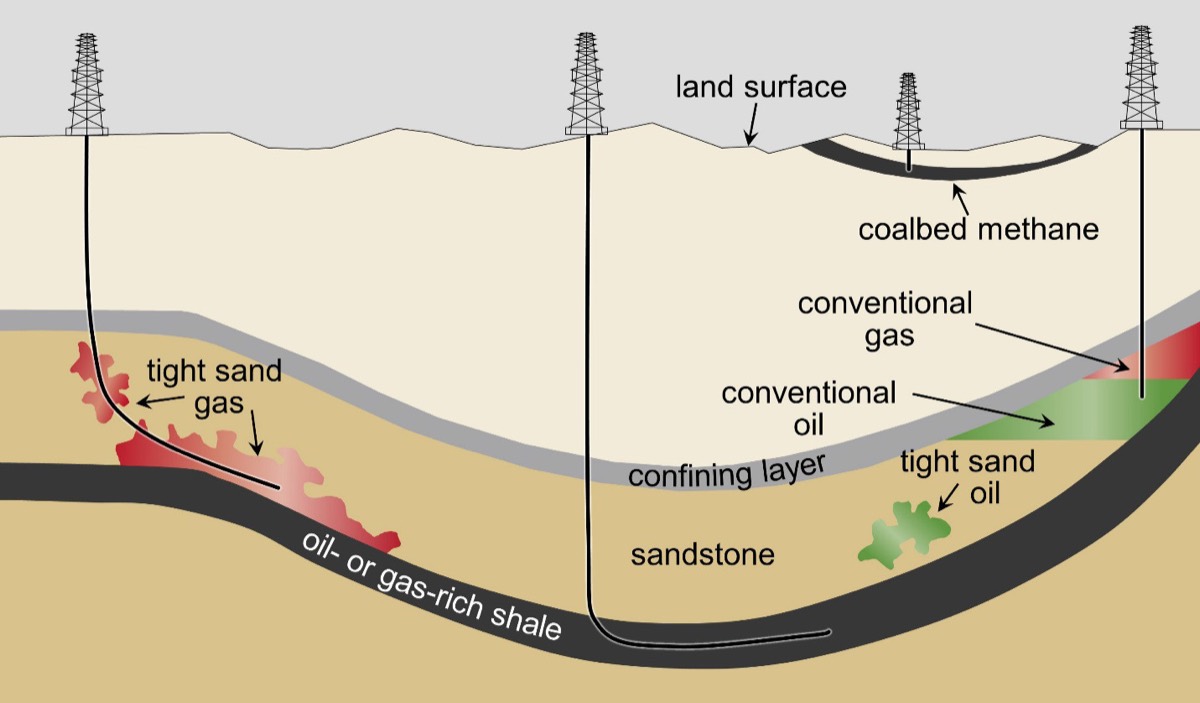
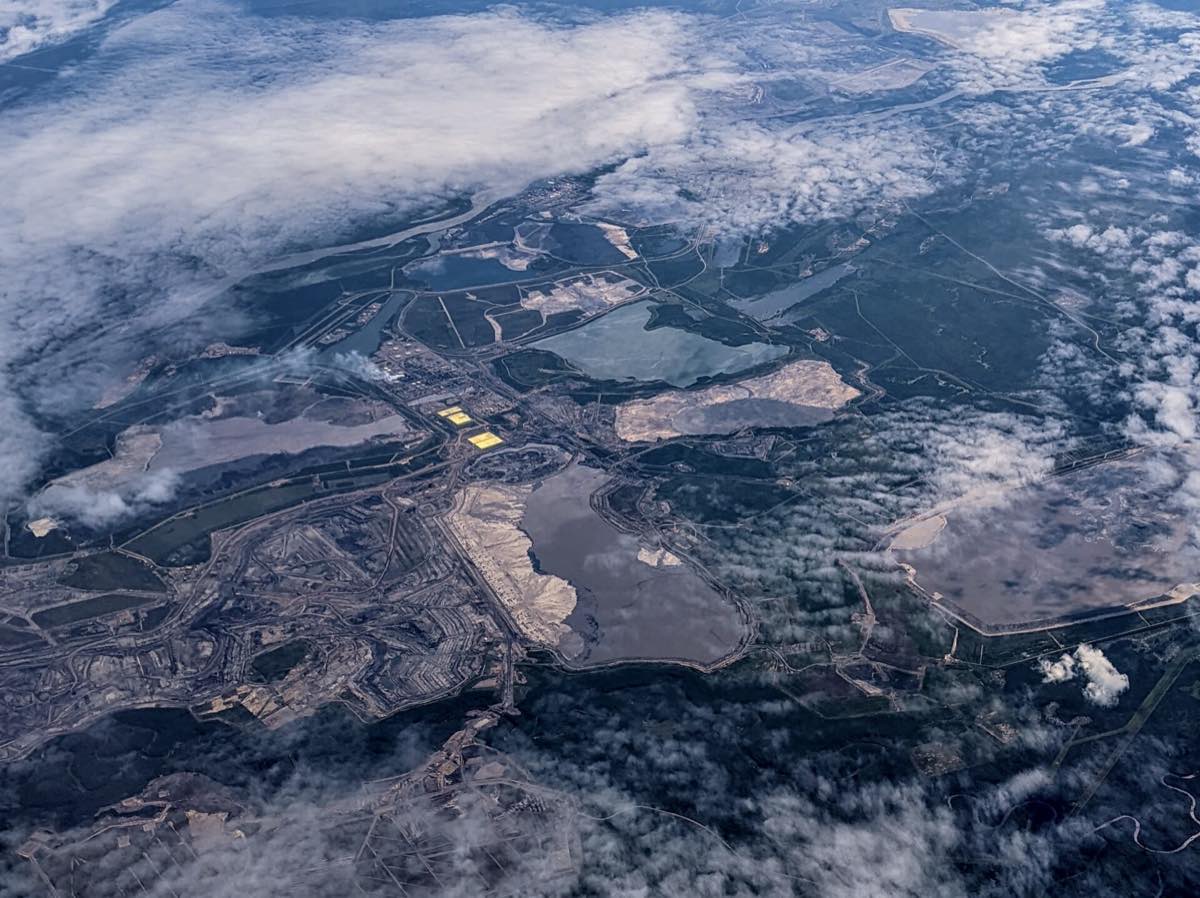
Oil that gets close to the surface is partly eaten by bacteria, leaving a heavy, viscous residue. Canada's oil sands and Venezuela's Orinoco belt are the giant examples, holding an estimated 3.6 trillion barrels of bitumen and extra-heavy oil between them.[5] Shale oil is a different case again. It never left the source rock, so producers reach it with horizontal wells and hydraulic fracturing, and those two techniques explain most of the rise in US output.
Crude Oil Grades
Refiners and traders describe a crude first by density and then by sulphur.[7] Density is given as API gravity:
API = (141.5 / specific gravity) − 131.5
The scale runs backwards, so lighter oil has a higher number. Water, at a specific gravity of 1.00, comes out at 10. A crude at 0.850 works out at 34.97 and counts as light, while one at 0.950 falls to 17.45 and counts as heavy.
| Grade | API gravity | Density (kg/m³) |
|---|---|---|
| Light | Above 31.1 | Below 870 |
| Medium | 22.3 to 31.1 | 870 to 920 |
| Heavy | Below 22.3 | 920 to 1,000 |
| Extra heavy | Below 10 | Above 1,000 |
Source: API gravity entry. Thresholds vary slightly between organisations.[6]
On sulphur, the usual dividing line is 0.5%: below it a crude is sweet, above it sour. The terms go back to nineteenth-century prospectors, who judged oil by tasting and smelling it.[6] Light sweet crude gives plenty of gasoline and diesel from simple distillation. Heavy sour crude needs more equipment and more expense to reach the same products,[7] and it is priced accordingly. Most international cargoes are sold at a premium or discount to a benchmark such as Brent.
Density also decides how barrels convert into tonnes. A barrel is 42 US gallons, or about 159 litres. At 850 kg/m³ a tonne occupies 1.18 m³, which comes to about 7.4 barrels. Heavier crude gives fewer barrels to the tonne and lighter crude gives more.
Recovery Stages
Much of the oil in a reservoir stays there. The US Department of Energy puts primary recovery, which relies on natural pressure and pumps, at about 10% of the oil originally in place. Secondary recovery, in which water or gas is injected to hold up pressure, brings the total to 20 to 40%. Tertiary or enhanced recovery uses heat, gas or chemicals and could reach 30 to 60%, sometimes more. In the US, gas injection accounts for nearly 60% of enhanced recovery output and thermal methods for over 40%, with chemical methods at about 1%.[8] For a field holding 1 billion barrels in place, primary recovery yields around 100 million barrels and secondary recovery raises that to between 200 and 400 million.
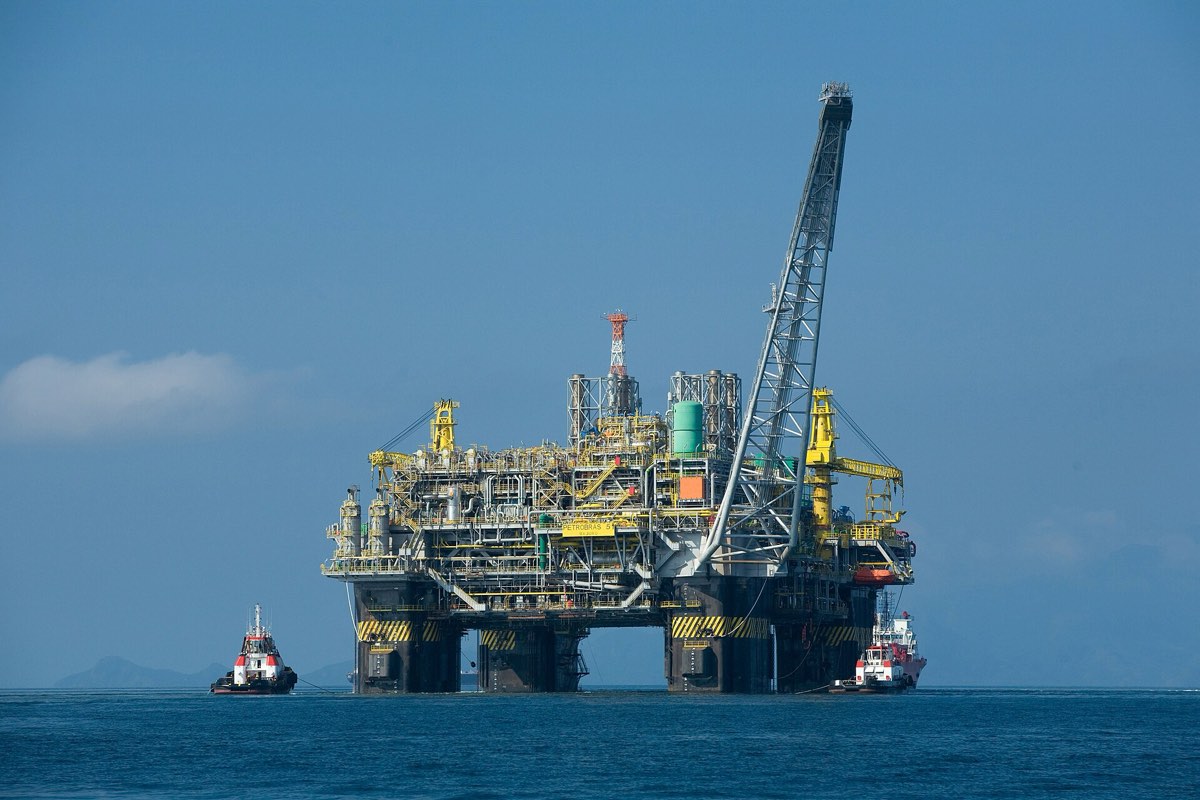
Whatever reaches the surface usually arrives mixed with gas and water and passes through separators at the field. Our articles on drilling rigs and oil wells cover how the hole is made and how a well produces.
What a Barrel Yields
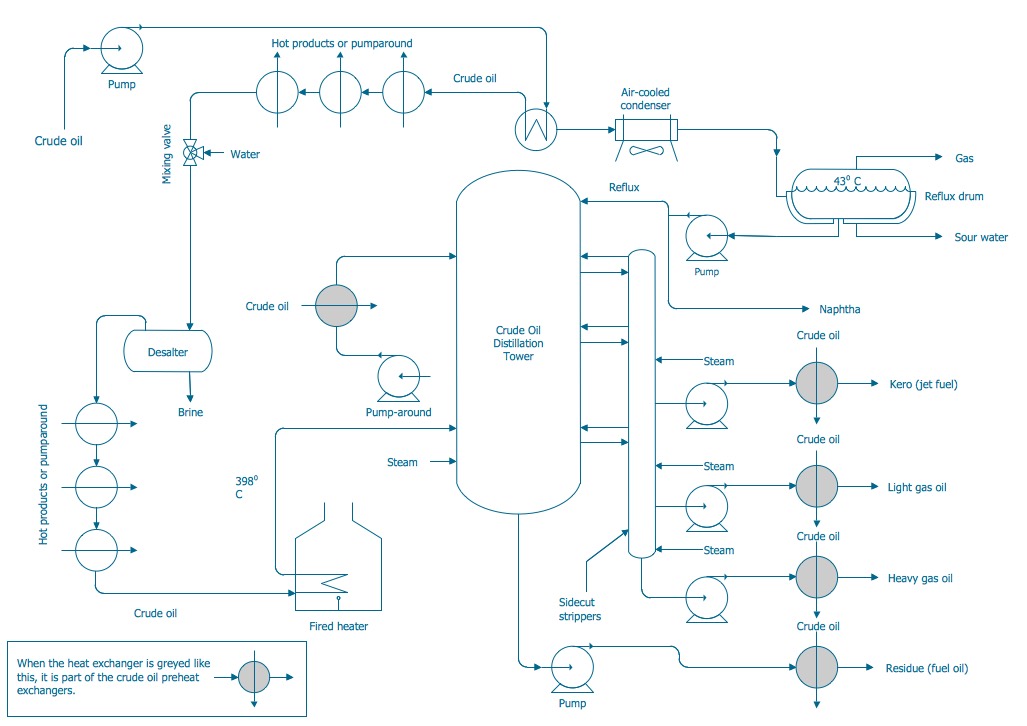
A refinery first separates crude by boiling range, then uses conversion units to crack heavy fractions into lighter ones. The process has its own article on oil refineries. Here is the output of an average 42-gallon barrel at US refineries in 2023.
| Product | Gallons | Share of output |
|---|---|---|
| Motor gasoline | 19.57 | 43.8% |
| Distillate fuel (diesel, gas oil) | 12.47 | 27.9% |
| Jet fuel | 4.41 | 9.9% |
| Petroleum coke | 2.06 | 4.6% |
| Still gas | 1.68 | 3.8% |
| Hydrocarbon gas liquids | 1.55 | 3.5% |
| Asphalt | 0.84 | 1.9% |
| Residual fuel oil | 0.71 | 1.6% |
| Other products | 1.36 | 3.0% |
| Total | 44.65 | 100% |
Source: EIA data, with shares calculated from it.[7] The total exceeds 42 gallons because most products are less dense than the crude they came from. This processing gain averaged about 6.3%.
These figures describe one country's heavily upgraded refining system and should not be read as a world average. Residual fuel oil at 1.6% shows how much of the bottom of the barrel US plants can convert. Simpler refineries make considerably more of it, and that residue is the base of much of the fuel burned at sea.
Who Produces and Who Holds Reserves
The US overtook Russia in 2018 and has led ever since, reaching a record 13.6 million barrels a day in 2025. Russia produced about 9.9 million and Saudi Arabia 9.6 million, leaving US output roughly 40% above their average.[1] Reserves point somewhere else entirely.
| Country | Proven reserves (billion barrels) | Date and source |
|---|---|---|
| Venezuela | 303.2 | 2024, OPEC |
| Saudi Arabia | 267.2 | 2024, OPEC |
| Iran | 208.6 | 2024, OPEC |
| Canada | 170 | 1 January 2024, Natural Resources Canada |
| United States | 46.4 | End of 2023, EIA |
Source: Oil & Gas Journal compilation.[9]
Proven reserves are what can be extracted with today's technology at today's prices, so the total depends on the method. OPEC gave 1,567 billion barrels of crude for the end of 2024, whereas OGJ projects 1,773 billion for the end of 2025.[2][9] A big number does not guarantee big output either. Venezuela holds more than six times the US figure, but most of it is extra-heavy oil that needs infrastructure and investment to bring out. What oil revenue does to producer economies is the subject of our article on oil and the Dutch disease.
World Consumption
Agencies define oil differently, so 2025 has no single figure. OPEC reports demand of 105.15 million barrels a day.[2] Numbers from the International Energy Agency's August 2026 report imply about 104.85 million.[3] The Energy Institute, counting crude and natural gas liquids, arrives at about 103 million, and adds that fossil fuels supplied 86% of a total energy supply that passed 600 exajoules.[4]
Oil's niche comes from energy density and portability. Road vehicles, aircraft and ships take most of their fuel from it, and the petrochemical industry takes its feedstock from it. Power generation is a small user outside a few producing countries.
Tankers and Chokepoints
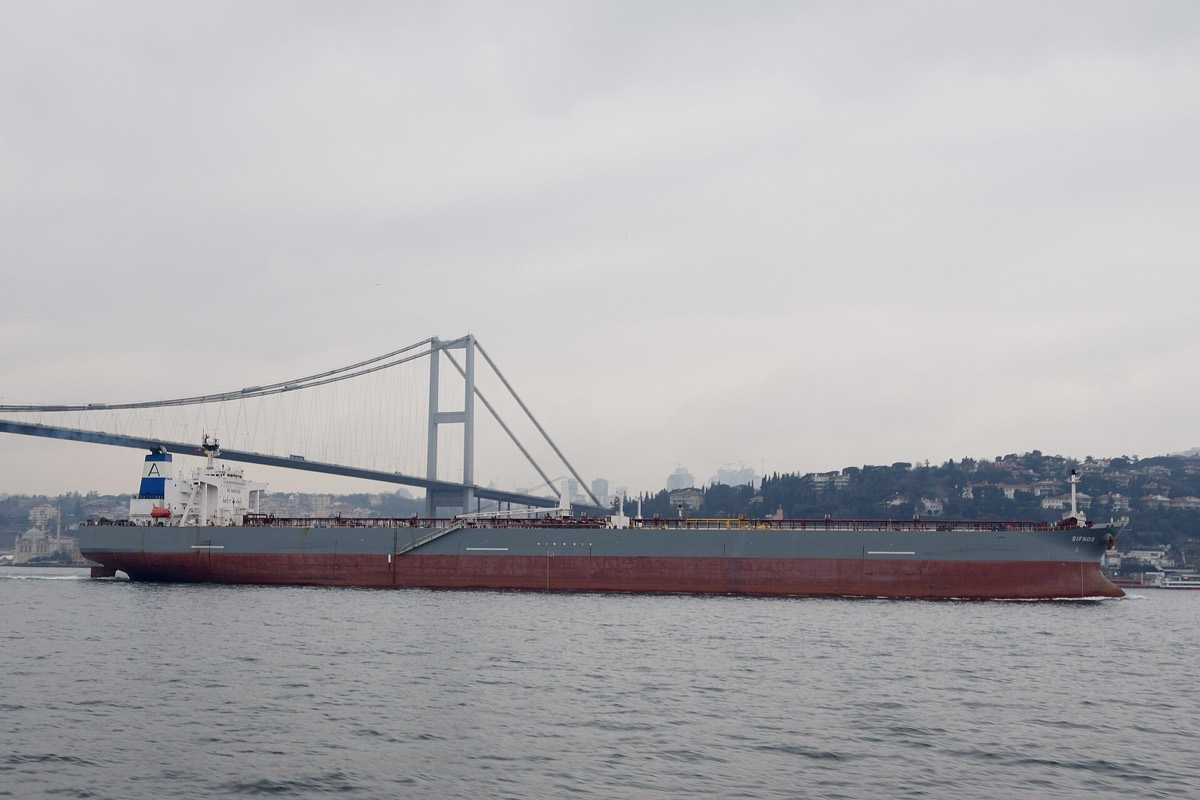
Crude is rarely refined where it is produced, so trade runs on tankers and pipelines. EIA estimates that a very large crude carrier (VLCC) lifts 1.9 to 2.2 million barrels of WTI-type crude and an ultra-large one (ULCC) about 2 to 3.7 million, against 190,000 to 345,000 barrels of gasoline on a medium-range product tanker.[11] Put another way, one day of world consumption would fill about 50 VLCCs.
That trade squeezes through a few narrow passages, of which the Strait of Hormuz at the mouth of the Persian Gulf matters most. An average of 20 million barrels a day went through it in 2024, about 20% of world petroleum liquids consumption and over a quarter of seaborne oil trade. Asia took 84% of the crude and condensate.[10]
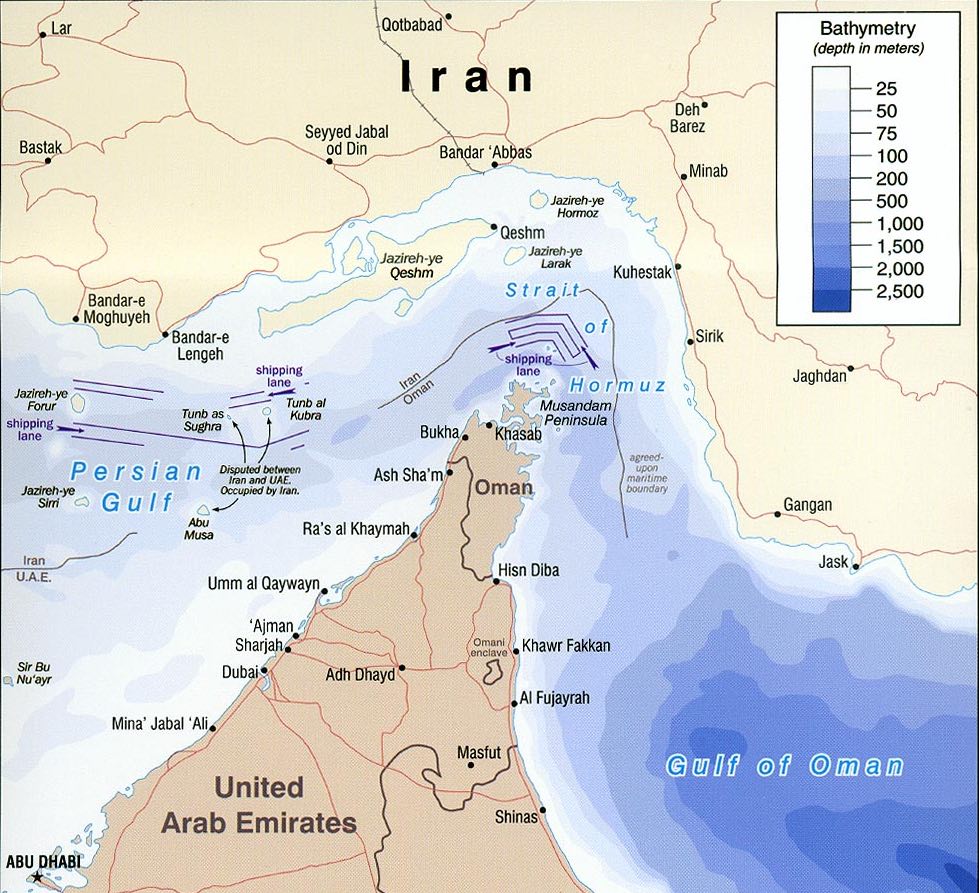
The strait closed in late February 2026. In its August 2026 report the IEA expected world demand to shrink by 1.56 million barrels a day that year, to 103.29 million. Kpler data put crude and condensate flows through Hormuz at about 9.44 million barrels a day in the first 25 days of October, around 65% of the February level.[3]
Environmental Effects
Burning oil releases carbon dioxide. Measurements at Mauna Loa show atmospheric CO₂ rising by 3.33 ppm in 2024 and 2.23 ppm in 2025.[12] Where no pipeline exists, associated gas is often flared at the field, which adds emissions and wastes the gas.
Spills have a sharper, local effect. Natural seeps release oil gradually, whereas a casualty like the Exxon Valdez puts a large volume into a small area within days. Weathered crude loses its volatile fractions, grows heavier and can form tar balls that keep reaching shore long afterwards.
From Crude to Marine Fuel
Crude quality carries through to the engine room. Sulphur, vanadium and nickel concentrate in the residue during distillation, so a sour feedstock tends to produce a high-sulphur fuel oil, with a risk of hot corrosion after combustion. The IMO 2020 sulphur limit applies at this end of the chain. Fuel categories and quality measures are compared in our guide to types of marine fuel, and the products Bunkerist supplies are on the Fuel Oil and Gas Oil page.
Frequently asked questions
What is petroleum?
Petroleum is a naturally occurring mixture of hydrocarbons trapped in rock.
Is petroleum the same as crude oil?
Crude oil is the unprocessed liquid from the well. Petroleum is the broader word and also covers refined products.
How many litres are in a barrel of oil?
A barrel holds 42 US gallons, or about 159 litres. Marine fuel is sold by the metric tonne, not by the barrel.
Is petroleum renewable?
No. It takes millions of years to form, far longer than the rate at which it is consumed, which is why it counts as a fossil fuel.
Which country produces the most oil?
The United States, at 13.6 million barrels a day in 2025 according to EIA. Russia follows at about 9.9 million and Saudi Arabia at 9.6 million.
Does Türkiye produce oil?
Yes, mostly in the south-east of the country. Fields and output figures are in our article on oil wells.
Sources
- US Energy Information Administration (EIA). The United States Produced More Crude Oil Than Any Other Country in 2025. Today in Energy, 9 July 2026.
- OPEC. 61st Edition of OPEC's Annual Statistical Bulletin Launched, 29 April 2026; 60th Edition Launched, 2 July 2025.
- Argus Media. IEA Sees Greater Oil Demand Fall in 2026, 12 August 2026 (reporting the IEA Oil Market Report); ADNOC's New Hormuz Bypass Seen Ready by 2Q 2027, October 2026 (Kpler data).
- Energy Institute. Statistical Review of World Energy 2026, as reported by DieselNet, July 2026.
- Wikipedia. Petroleum. Used as a secondary source.
- Wikipedia. API Gravity; Sweet Crude Oil. Used as a secondary source.
- US Energy Information Administration (EIA). Refining Crude Oil: Inputs and Outputs. Petroleum Supply Monthly data, 2023.
- US Department of Energy. Enhanced Oil Recovery. Office of Fossil Energy and Carbon Management.
- Oil & Gas Journal. OGJ Survey Reveals Increase in Global Oil, Gas Reserves, 8 December 2025.
- US Energy Information Administration (EIA). Amid Regional Conflict, the Strait of Hormuz Remains Critical Oil Chokepoint. Today in Energy, 16 June 2025.
- US Energy Information Administration (EIA). Oil Tanker Sizes Range from General Purpose to Ultra-Large Crude Carriers on AFRA Scale. Today in Energy, 16 September 2014.
- NOAA Global Monitoring Laboratory. Annual Mean Growth Rate for Mauna Loa, Hawaii.