How the Closure of the Strait of Hormuz Hit Bunker Fuels
When Iran announced the closure of the Strait of Hormuz on 2 March 2026, a tonne of VLSFO in Singapore cost $521. Eleven days later it cost $1,120. The price has not returned to its pre-war level since; the October average was $929.[11]
A large share of the fuel oil burned by the world's ships also came out of the Gulf. When the strait closed, that fuel left the market and ships that used to bunker at Fujairah moved to Singapore. By our calculation the world merchant fleet paid about $45 billion more for fuel between March and October than it would have paid at pre-war prices. The International Monetary Fund (IMF) estimates that the shock took a net 0.3 percentage points off world growth in 2026, roughly $350 billion.
How the Strait Closed
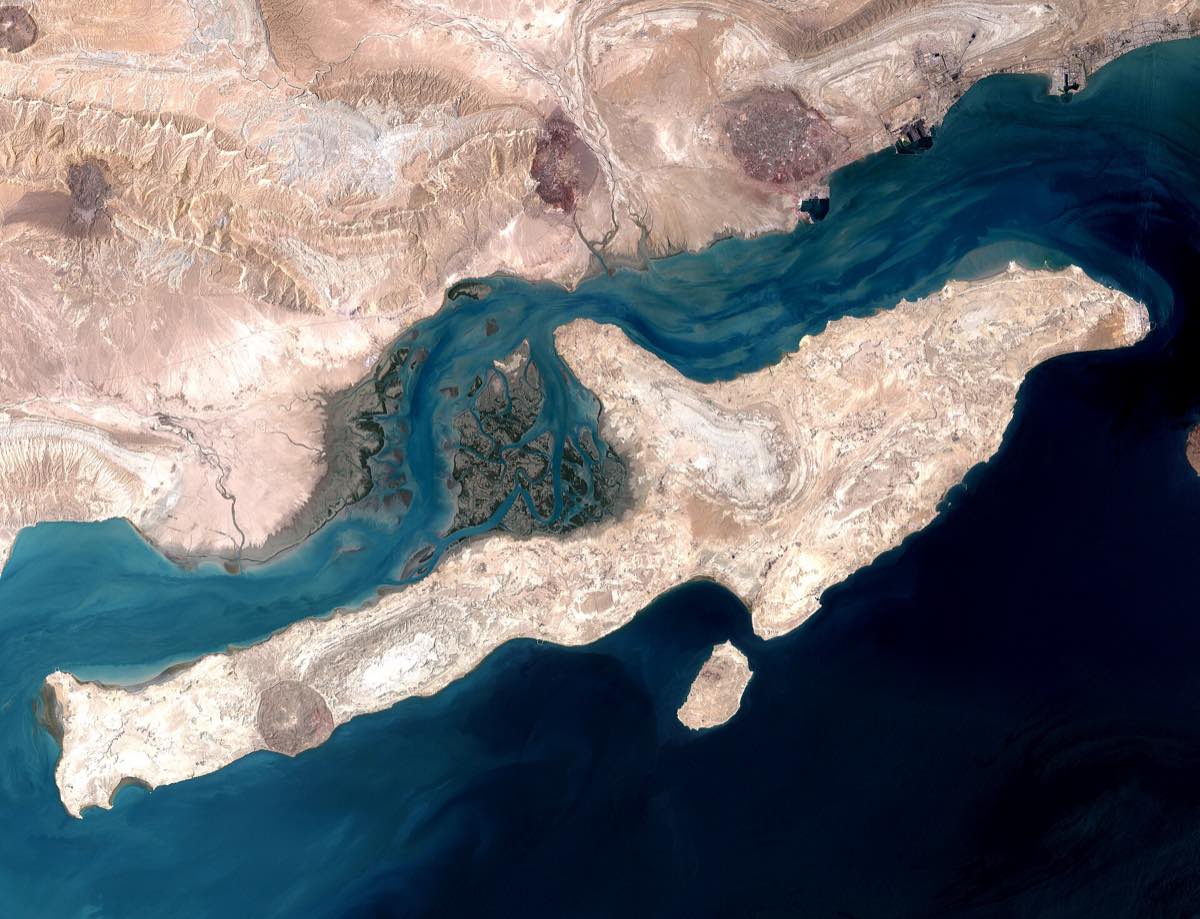
The US and Israeli strikes on Iran began on 28 February, and Iran's Revolutionary Guard announced on 2 March that it had closed the strait. Before the war about 20 million barrels of oil a day passed through Hormuz, a fifth of world consumption.[1] In the quarterly series of the US Energy Information Administration (EIA), flows through the strait were 21.6 million barrels a day in the last quarter of 2025. They fell to 5.1 million in the second quarter of 2026 and 9.1 million in the third.[2]
The International Energy Agency (IEA) wrote in its March report that Gulf producers had cut output by at least 10 million barrels a day. The World Bank called it the largest oil supply shock on record.[3][4] On 11 March IEA members agreed to release 400 million barrels of emergency stocks.[5] The strait partly reopened in June. The ceasefire collapsed at the start of July and the strait closed again. According to the IEA's November report, a total of 462 million barrels has been drawn from world oil stocks since the end of February.[6]
The Gulf's Place in Bunker Supply
Besides crude, the Gulf countries exported large volumes of fuel oil. According to the IEA's March report, in 2025 the region shipped about 270,000 barrels a day of straight-run fuel oil, 420,000 barrels a day of high sulphur fuel oil (HSFO) and 70,000 barrels a day of very low sulphur fuel oil (VLSFO). That is 760,000 barrels a day in total, between 15 and 20 percent of world fuel oil trade. The IEA notes that most of these exports went into the bunker market.[3] Kpler's ship tracking data shows the same order of magnitude: between January 2025 and February 2026 an average of 3.7 million tonnes of fuel oil a month passed through the strait, about 1.2 million tonnes of it to Asia.[7] The IEA's 760,000 barrels a day converts to 3.6 million tonnes a month, so the two sources give almost the same figure.
UNCTAD's report of 29 October measures the loss. Fuel oil exports from Bahrain, Kuwait and Saudi Arabia between March and June were 7.2 million tonnes in 2025 and 2.5 million tonnes in 2026, a fall of 65 percent. Diesel exports from the three countries fell from 17.9 million to 12 million tonnes.[8] Fujairah's fuel oil imports were 305,000 barrels a day in January, 14,000 in March and zero in April.[9]
What Happened to Bunker Prices
According to UNCTAD's first assessment on 10 March, HSFO and VLSFO prices in Singapore rose by about 100 percent between 27 February and 9 March.[10] VLSFO in Singapore cost $521.5 a tonne the day before the war and peaked at $1,120.5 on 13 March.[11] On that day the spread for the same fuel between Singapore and Rotterdam reached $362. An analysis by Danish Shipping based on Clarksons data says this spread normally sits between $20 and $60. The previous highs were $157 during the 2020 sulphur cap transition and $249 in the 2022 energy crisis.[12] Because the lost supply was east of the Gulf, the shock hit Asia hardest. European ports were much less affected in the same weeks.
| Indicator | Pre-war | 2026 war period |
|---|---|---|
| Brent crude, monthly average ($/barrel) | 68.75 (January, February) | 103.24 (March-October average), peak 123.93 (October) |
| Singapore, VLSFO ($/tonne) | 521.5 (27 February) | 1,120.5 (13 March), October average 929 |
| Same fuel, Singapore minus Rotterdam ($/tonne) | 20-60 (normal range) | 362 (13 March, record) |
| Singapore bunker average, change | September 2025-February 2026 average | 72% higher (20 October) |
| VLCC freight, Gulf-China ($/day) | 56,000 (9 January) | 1.37 million (16 October) |
Source: EIA Brent series[2], Ship & Bunker data[11], Danish Shipping[12], UNCTAD[8].
The spread between grades widened too. The VLSFO-HSFO spread in Singapore averaged $220 in the first week of the war, about three times the previous week. In Fujairah it went above $260. In Rotterdam and Gibraltar it rose by only $12 to $18.[13] Much of what the Gulf stopped supplying was VLSFO and MGO. Ships with scrubbers burning HSFO suffered less in this period than ships running on VLSFO.
Through the war prices tracked Brent. Monthly VLSFO averages in Singapore from May to October were $825, $753, $755, $822, $870 and $929.[11] Brent averaged $100.9 over those six months, so a tonne of VLSFO sold for roughly the price of 8.2 barrels of Brent. UNCTAD says that on 20 October the average of VLSFO and HSFO in Singapore was 72 percent above the average of the six pre-war months. Diesel was up 81 percent and jet fuel 80 percent.[8]
Where Ships Bunkered Instead
The war also changed where bunkers were sold. The biggest loser was Fujairah, even though it lies outside the strait. Most of its customers were tankers going in and out of the Gulf, storage at the Fujairah Oil Industry Zone was attacked in March and many suppliers stopped delivering. According to Fujairah Oil Industry Zone (FOIZ) data, 7.27 million tonnes of bunkers were sold at Fujairah in 2025. In the first ten months of 2026 sales came to 2.58 million tonnes, 58 percent below the same period a year earlier.[14] The weakest month was June at 86,769 tonnes.[15]
| Port and period | 2026 (million t) | 2025 (million t) | Change |
|---|---|---|---|
| Singapore, Jan-Sep | 42.49 | 41.63 | up 2.1% |
| Fujairah, Jan-Oct | 2.58 | about 6.1 | down 58% |
| Rotterdam, Jan-Sep | 5.1 | 6.9 | down 26% |
Source: MPA monthly bunker sales data[16], FOIZ and S&P Global[14], Port of Rotterdam data[17]. The Rotterdam figure covers conventional fuels only. Most of the fall there comes from the Netherlands' RED III rules, in force since 1 January 2026: the greenhouse gas reduction obligation placed on fuel suppliers made bunkers in Rotterdam more expensive, and some buyers moved to Antwerp and Hamburg.[35]
Singapore held on to its demand. In its April report the IEA wrote that Singapore was the only major consumer whose bunker forecast had been revised up significantly. February sales, at 1.1 million barrels a day, were 12.2 percent above a year earlier.[18] The interesting part of the Maritime and Port Authority of Singapore (MPA) data is the product mix. HSFO sales in Singapore rose from 1.62 to 1.93 million tonnes in March and from 1.70 to 2.03 million tonnes in June. VLSFO and MGO sales were flat or lower.[16] With less VLSFO and MGO coming from the Gulf, ships took what they could get, and scrubber-fitted ships kept burning HSFO.
Tight supply also showed up in fuel quality. At the end of April Skuld warned about fuels bought in Southeast Asia that passed ISO 8217 tests but turned out to be contaminated in further analysis.[19] According to fuel testing company VPS, 29 fuel quality alerts were issued between January and July. For the whole of 2025 the number was 37.[20]
Istanbul and Turkish Ships
In Turkey the shock was milder than in Asia. In Istanbul VLSFO cost $645 a tonne the day before the war and peaked at $1,029 on 2 April. At the peak the rise was 60 percent, against 115 percent in Singapore.[41] In our view the reason is that the Eastern Mediterranean gets most of its fuel from Mediterranean and Black Sea refineries. Istanbul was already more expensive than Rotterdam: the VLSFO spread between the two ports was $167 a tonne in February and narrowed to $142.5 on 16 November.[41]
In Istanbul the real problem was MGO. MGO cost $800.5 before the war, reached $1,515 on 31 March and hit the year's high of $1,696 on 16 September. On 16 November it was still $1,409, 76 percent above the pre-war price.[41] The Mediterranean has been a sulphur emission control area since 1 May 2025, so ships there must burn fuel with no more than 0.10 percent sulphur, and most of that demand is met with MGO.[48] MABUX calculated that in Istanbul the spread between this low sulphur fuel and conventional fuel rose from $100 to $225 in the first week of the war.[47]
| Istanbul ($/t) | 27 Feb | 2026 peak | 16 Nov |
|---|---|---|---|
| VLSFO | 645 | 1,029 (2 April) | 890.5 |
| HSFO | 490 | 904 (2 April) | 760.5 |
| MGO | 800.5 | 1,696 (16 September) | 1,409 |
Source: Ship & Bunker Istanbul price data.[41]
Turkish shipowners were caught up in the war as well. On 11 March Transport and Infrastructure Minister Abdulkadir Uraloğlu said there were 15 Turkish-owned ships in Hormuz and the Persian Gulf.[42] On 26 June, in the weeks when the strait was partly open, he announced that all of them, with the 99 Turkish seafarers on board, had left the region safely. Three Turkish-owned ships stayed in the region and kept trading.[43]
The war also made Ceyhan more important. With seaborne shipments halted, Iraq restarted flows through the Kirkuk-Ceyhan pipeline on 18 March at about 100,000 barrels a day.[44] In July the pipeline agreement was extended by a year and 750,000 barrels a day of capacity was allocated.[45] Traffic through the Bosphorus did not change noticeably: 19,277 ships passed in the first six months of the year, against 19,381 a year earlier.[46]
Insurance and Freight
War risk insurance became the biggest cost after fuel for a ship entering the Gulf. The additional premium, around 0.25 percent of vessel value before the war, rose to 1 percent within the first week, according to UNCTAD.[10] Lloyd's data cited in a Howden Re report of 26 March put the premium at about 5 percent of vessel value on 19 March.[21] In early October brokers who spoke to the Financial Times were quoting 6 to 10 percent for tankers. For a $100 million tanker that is $6 to $10 million for a single transit.[22] What underwriters feared did happen. The container ship Safeen Prestige, hit in early March, sank in April, and in mid-October the Singapore-flagged GFS Pride was hit and sank.[36][37]
Freight rose even more sharply. Daily earnings of a VLCC crude tanker trading between the Gulf and China were $56,000 on 9 January and $1.37 million on 16 October.[8] Part of that rise reflects fuel and insurance costs, most of it the shrinking supply of ships. In April the IMO Secretary-General said about 1,600 ships and 20,000 seafarers were stranded in the Gulf.[23] According to an IMO statement in early November, at least 25 seafarers have been killed around the strait since the war began.[24]
Calculating the Economic Loss
No official body has published a total dollar figure for bunkers. The IMF gives only the growth effect in percentage points. So we split the loss into four items and calculated each one ourselves from public data.
1. The Fleet's Extra Fuel Bill
According to the IMO Fuel Oil Data Collection System, ships above 5,000 gross tonnage consumed 223 million tonnes of fuel in 2024. The system covers 91 percent of the world fleet by tonnage. Adding the missing tonnage brings annual consumption to around 245 million tonnes.[25] For the eight months from March to October that is about 163 million tonnes of fuel.
For the price increase we used VLSFO in Singapore, because it accounts for about half of world sales and has the widest data set. Monthly averages from May to October are known. For April we used the $747 published by Argus and for March the $889 derived from it. The eight-month average is $824 a tonne, $304 above the pre-war level of $520.
| Step | Value |
|---|---|
| Annual world bunker consumption | 245 million tonnes |
| March-October consumption (8 months) | 163.3 million tonnes |
| Average price increase per tonne | $304 |
| Gross extra cost | $49.6 billion |
| HSFO adjustment (rose about $120 less, 38.7% share) | minus $7.6 billion |
| MGO adjustment (rose about $240 more, 7.6% share) | plus $3.0 billion |
| Net extra fuel bill | about $45 billion |
The HSFO adjustment rests on the spread between the two fuels in Singapore widening from around $75 before the war to between $180 and $240.[13] For the MGO adjustment we used the 81 percent rise UNCTAD gives for diesel and assumed a pre-war MGO price of $700 a tonne.[8]
We checked the result in two independent ways. Maersk burned about 10.6 million tonnes of fuel in 2025.[38] That is about 5 percent of world consumption reported to the IMO.[39] A $304 rise per tonne means an extra bill of about $2.2 billion over eight months for that company alone. Applied to the whole fleet the same ratio gives $43 billion, close to the main calculation. The European campaign group Transport & Environment (T&E) calculated that in the first month of the war at least €340 million a day was added to the bunker bill.[26] That figure rests on the peak prices of March, so spread over eight months it comes out higher than ours.
2. War Risk Insurance
US Central Command said more than 3,000 merchant ships crossed the strait with its support in the six months from April to October.[27] Including transits in March and November, we assumed about 3,500 transits in total. With an average vessel value of $50 million, an average premium of 3 percent comes to about $5 billion. Because the premium ranged from 0.5 to 7.5 percent, the true figure could be anywhere between $1 billion and $13 billion. This is the least certain item in the calculation.
3. Fujairah's Lost Sales
Fujairah sold about 6.1 million tonnes of bunkers in the first ten months of 2025 and 2.58 million tonnes in the same period of 2026. The difference of about 3.6 million tonnes, at an average price of $824, is about $3 billion in turnover. The loss is real for Fujairah and the United Arab Emirates, but for the world most of those sales moved to other ports such as Singapore. So it is left out of the total.
4. The Effect on the World Economy
In its October 2026 World Economic Outlook the IMF calculates that, without a supply response, the closure would have pushed oil to $110 and taken 0.9 percentage points off global growth in 2026. Stock releases and weaker demand held the price effect to $85. Taking into account the lower oil intensity of economies, the net effect is 0.3 points.[28] With the world economy at about $115 trillion, 0.3 points is about $350 billion, and 0.9 points is over $1 trillion. A Dallas Fed study in March had projected that if the strait stayed closed for three quarters, world growth in 2026 would fall by 1.3 points.[29]
The money flowing from oil consumers to producers is a separate item. Brent's March-October average was $34.5 above the pre-war level. With world consumption of 102 million barrels a day, that comes to about $860 billion over eight months. Part of this is not a loss, as it went to oil exporting countries and companies. The extra $45 billion paid for bunkers is inside this amount, the share that fell on shipping.
| Item | Estimate | Nature |
|---|---|---|
| Fleet extra fuel bill (March-October) | about $45 billion | cost to owners and charterers |
| War risk insurance | $1-13 billion, central estimate 5 | cost to ships entering the Gulf |
| Fujairah's lost bunker turnover | about $3 billion | regional loss, sales moved to other ports |
| Global output loss (IMF, net 0.3 points) | about $350 billion | net loss to the world economy |
| Transfer from oil consumers to producers | about $860 billion | mostly a change of hands |
Who Ends Up Paying
The cost of bunkers does not stay with the shipowner. Under a time charter the fuel bill goes to the charterer, and on a container line it goes to the cargo owner through the bunker adjustment factor added to freight, and from there to the consumer. Maersk's own figure shows this clearly: the company says a $100 per tonne rise in fuel prices, after the part passed on in freight, affects its 2026 operating profit by about $300 million.[40] For a company burning 10.6 million tonnes a year the gross effect is over $1 billion. The difference goes to the cargo owner. A 2010 UNCTAD study found that a 10 percent rise in the oil price raised container freight rates by 1.9 to 3.6 percent.[30] A 2022 IMF study shows that freight shocks feed into import prices and inflation, with an effect similar in size to oil shocks but longer lasting.[31] For the 2024 Red Sea crisis, the European Central Bank estimated that the effective closure of Suez added about 0.25 points to euro area inflation in 2024 and 2025.[32] A Dallas Fed study published in November finds that major chokepoint disruptions such as the Red Sea and Hormuz raised US consumer prices by about 0.2 percent for around two years.[33]
What sets Hormuz apart is that cargo and fuel come from the same place. In the Red Sea crisis ships sailed round the Cape of Good Hope and burned more fuel, but the fuel itself was plentiful and relatively cheap. At Hormuz both the oil ships carry and the fuel oil they burn fell at the same time. That is why the price effect was far larger than in the Red Sea and far more uneven geographically: ships bunkering in Asian ports carried the heaviest load.
Limits of the Calculation
The figures rest on estimates at several points. Singapore's May-October averages come from Ship & Bunker and the April average from Argus, and the two indices are not identical. The March average was derived because none has been published; as it was the month with the highest prices, this is the weakest point of the calculation. The Singapore price was used for the whole world. Price increases were smaller in European and American ports, so the true extra bill may be somewhat below $45 billion. On the other hand, lower Gulf traffic reduced total fuel consumption somewhat, while ships avoiding the Gulf on longer routes increased it. We found no reliable measure of these two effects and left them out. The number of transits and the vessel value in the insurance item are assumptions. The IMF growth estimate was converted to dollars assuming a world economy of about $115 trillion.
Assessment
For shipowners the most concrete result of this crisis is that the scrubber calculation has changed. Owners who did not fit scrubbers after the 2020 sulphur cap looked right while the VLSFO-HSFO spread hovered around $60 to $80. In March the spread reached $220 in Singapore and $260 in Fujairah, and scrubber-fitted ships made the same voyage far more cheaply.[13] Now that the Hi5 spread has shown how volatile it can be, a scrubber should also be counted as insurance against fuel price risk.
The second result is how fragile a bunkering port can be. Fujairah was one of the largest bunkering ports in the world, but its customers were ships going in and out of the Gulf. When that traffic stopped, its sales fell by more than half. Singapore, serving ships from every direction, increased its sales. Fujairah's sales rose 19 percent in October[14], but whether that recovery lasts will depend on the strait.
For a shipowner buying fuel in Turkey and the Eastern Mediterranean the picture is different. The rise in VLSFO stayed behind Asia's, but MGO is still 76 percent above its pre-war level. For ships on short sea trades burning MGO inside the emission control area, this year's real cost came from there.
We do not expect prices to return to pre-war levels soon. The IMF's baseline assumes the strait reopens in March 2027 and conditions return to normal only by October 2027.[28] Even after the strait reopens, fuel oil supply will stay tight until Gulf refinery exports recover. Planning a 2027 fuel budget on pre-war prices therefore does not look realistic. For bunkering conditions in Turkish ports see our port pages, and for the differences between VLSFO, HSFO and MGO see the Types of Marine Fuel guide.
Sources
- U.S. Energy Information Administration. Amid regional conflict, the Strait of Hormuz remains critical oil chokepoint, Today in Energy, 24 June 2025.
- U.S. Energy Information Administration. Short-Term Energy Outlook, November 2026; Europe Brent Spot Price FOB, monthly series.
- International Energy Agency. Oil Market Report, March 2026.
- World Bank. Commodity Markets Outlook, April 2026.
- International Energy Agency. IEA member countries' collective action, press release, 19 March 2026.
- International Energy Agency. Oil Market Report, November 2026.
- Reuters, Baird Maritime. Vitol: Hormuz flare-up, low exports keep fuel oil premiums high, 2026 (Kpler data).
- UNCTAD. Soaring Fuel Prices and the Burden of Inflation, 29 October 2026.
- ENGINE. Fujairah's Hi5 spread widens as VLSFO remains scarce, 25 September 2026.
- UNCTAD. Strait of Hormuz Disruptions: Implications for Global Trade and Development, 10 March 2026.
- Ship & Bunker. Singapore VLSFO daily and monthly price data, March-October 2026 (via Splash247, BigMint and IndexBox).
- Danish Shipping. Record-wide bunker price spread between Asia and Europe during the Hormuz crisis, June 2026 (Clarksons data).
- ENGINE. Asian Hi5 spreads sharply wider from Middle East war, 17 March 2026.
- ENGINE. Fujairah bunker sales rose 19% in October, 17 November 2026 (FOIZ and S&P Global Commodity Insights data).
- Reuters, Baird Maritime. Fujairah bunker sales bounce back from record low during brief US-Iran lull, 17 August 2026.
- Maritime and Port Authority of Singapore. Bunker Sales Total and Breakdown, Monthly, data.gov.sg, January-September 2025 and 2026.
- ENGINE. Rotterdam's conventional bunker sales rebound 10% from previous quarter, 22 October 2026 (Port of Rotterdam data).
- International Energy Agency. Oil Market Report, April 2026.
- Manifold Times. Skuld: Bunker fuels from Southeast Asia contaminated with unusual chemical compounds, 27 April 2026.
- Petro Online. VPS data: bunker alerts in seven months near 2025 total, 2026.
- Howden Re. Strait of Hormuz, Business Intelligence report, 26 March 2026.
- Insurance Business. Hormuz sinking hands marine war underwriters another total loss as attacks surge, 14 October 2026.
- IMO. No safe transit through Hormuz, Secretary-General statement, 24 April 2026.
- Marine Insight. At least 25 seafarers killed in Strait of Hormuz since war began, says IMO, 8 November 2026.
- IMO. Report of fuel oil consumption data submitted to the IMO Ship Fuel Oil Consumption Database in GISIS, MEPC 84/6/1, 2025.
- ENGINE. Hormuz crisis adds €4.6 billion to bunker fuel bill: T&E, 31 March 2026.
- Al Jazeera. US military says it helped Gulf states export 1.5 billion barrels of oil, 26 October 2026.
- International Monetary Fund. World Economic Outlook: Resilience Under Strain, Urgent Choices, October 2026.
- Kilian, L., Plante, M. and Richter, A. What the closure of the Strait of Hormuz means for the global economy, Dallas Fed Economics, 20 March 2026.
- Beverelli, C., Benamara, H. and Asariotis, R. Oil Prices and Maritime Freight Rates: An Empirical Investigation, UNCTAD, 2010.
- Carrière-Swallow, Y., Deb, P., Furceri, D., Jiménez, D. and Ostry, J. D. Shipping Costs and Inflation, IMF Working Paper WP/22/61, 2022.
- European Central Bank. ECB staff macroeconomic projections for the euro area, March 2024, Box 3.
- Reyes-Heroles, R. and Zhou, Y. Maritime Chokepoint Disruptions, Trade and U.S. Inflation, Dallas Fed Working Paper 2638, 9 November 2026.
- Argus Media. Singapore monthly VLSFO average, April 2026, 5 May 2026 (via Pulse).
- S&P Global Commodity Insights. Higher RED III compliance costs divert bunker demand from Rotterdam, 9 September 2026.
- The Maritime Executive. Safeen Prestige reportedly sank in the Strait of Hormuz, April 2026.
- gCaptain. Containership sinks as Hormuz attacks spiral out of control, 14 October 2026.
- Ship & Bunker. Maersk Q3 2026 fuel consumption report, November 2026.
- IMO. Fuel oil consumption data, reporting year 2023, IMO Ship Fuel Oil Consumption Database, Table 2.
- A.P. Moller-Maersk. Maersk delivers strong performance in 2025 and business progress, 5 February 2026.
- Ship & Bunker. Istanbul Bunker Prices, daily VLSFO, MGO and IFO380 data, February-November 2026.
- GZT. Bakan Uraloğlu: Hürmüz Boğazı'nda 15 Türk sahipli gemi var [Minister Uraloğlu: 15 Turkish-owned ships in the Strait of Hormuz], 11 March 2026.
- GZT. Bakan duyurdu: 15 gemimiz güvenli şekilde Hürmüz Boğazı ve Basra Körfezi'nden ayrıldı [Minister: 15 of our ships left Hormuz and the Persian Gulf safely], 26 June 2026.
- Rudaw. Restart of flows on the Kirkuk-Ceyhan pipeline (in Turkish), 18 March 2026.
- Bloomberg HT. Kerkük-Ceyhan'da yeni formül: kapasite artışıyla 1 yıllık uzatma [New formula for Kirkuk-Ceyhan: one-year extension with higher capacity], July 2026.
- CNN Türk. Türk Boğazlarından 6 ayda 40 bin 218 gemi geçti [40,218 ships passed the Turkish Straits in six months], 2026.
- Hellenic Shipping News. MABUX: Bunker prices skyrocketing, 6 March 2026.
- IMO. Mediterranean Sea Emission Control Area for Sulphur Oxides, MARPOL Annex VI, in force from 1 May 2025.
Related Articles
Oil prices fall as expectations of a supply surplus come to the fore
The IEA forecasts that supply will exceed demand; oil prices have fallen amid expectations of a supply surplus
Oil prices head for a second consecutive weekly decline amid signs of a growing supply glut