Renewable Energy and Its Main Sources
How solar, wind, hydro, geothermal and biomass work, the 2025 figures, Türkiye, grid limits and the link with shipping.
Renewable energy comes from sources that replenish themselves as they are used: sunlight, wind, moving water, the Earth's internal heat and biomass. On Ember's figures, renewables generated 10,730 TWh in 2025, or 33.8% of the world's electricity, passing coal (33.0%) for the first time.[1] Their share of total energy is far smaller. The Energy Institute reports that fossil fuels still supplied about 86% of primary energy in 2025.[2] The two numbers sit so far apart because heating, industry and transport mostly run outside the power system.
Renewable, Clean and Low-Carbon
These terms describe different things. Renewable refers to a source that does not run out with use. Low-carbon refers to how much greenhouse gas is released in producing the energy. A nuclear plant emits no CO₂ while running, yet uranium is finite, so nuclear stays out of renewable statistics. Biomass counts as renewable although burning it pollutes the air and its climate effect depends on the feedstock. Large dams are renewable and still alter rivers and displace communities. Official targets need reading with these distinctions in mind.
Capacity and Generation
The International Renewable Energy Agency (IRENA) puts installed renewable capacity at 5,149 GW at the end of 2025, which is 49% of all power capacity. Additions of 692 GW over the year meant growth of 15.5%, and renewables made up 85.6% of all new capacity.[3]
| Source | Capacity, end 2025 (GW) | Added in 2025 (GW) |
|---|---|---|
| Solar | About 2,392 | 511 |
| Hydropower | About 1,296 | 18 |
| Wind | About 1,291 | 159 |
| Bioenergy, geothermal, marine | About 170 (154, 16, 0.5) | About 4 |
Source: IRENA, Renewable Capacity Statistics 2026, press summaries.[3] The total comes to about 5,149 GW.
Capacity and generation tell different stories: 49% of capacity produces 33.8% of electricity. The capacity factor explains the gap. It is the electricity a plant actually generates over a year as a share of what it would produce running flat out. Solar shows it plainly. Dividing 2025 output of 2,778 TWh by 2,392 GW times 8,760 hours gives about 13%, and the true value is slightly higher because plants added during the year did not run for all of it.[1][3] On the same arithmetic, 1 GW at a 15% capacity factor yields about 1.3 TWh a year, and at 40% about 3.5 TWh.
The Main Sources and How They Work
Solar
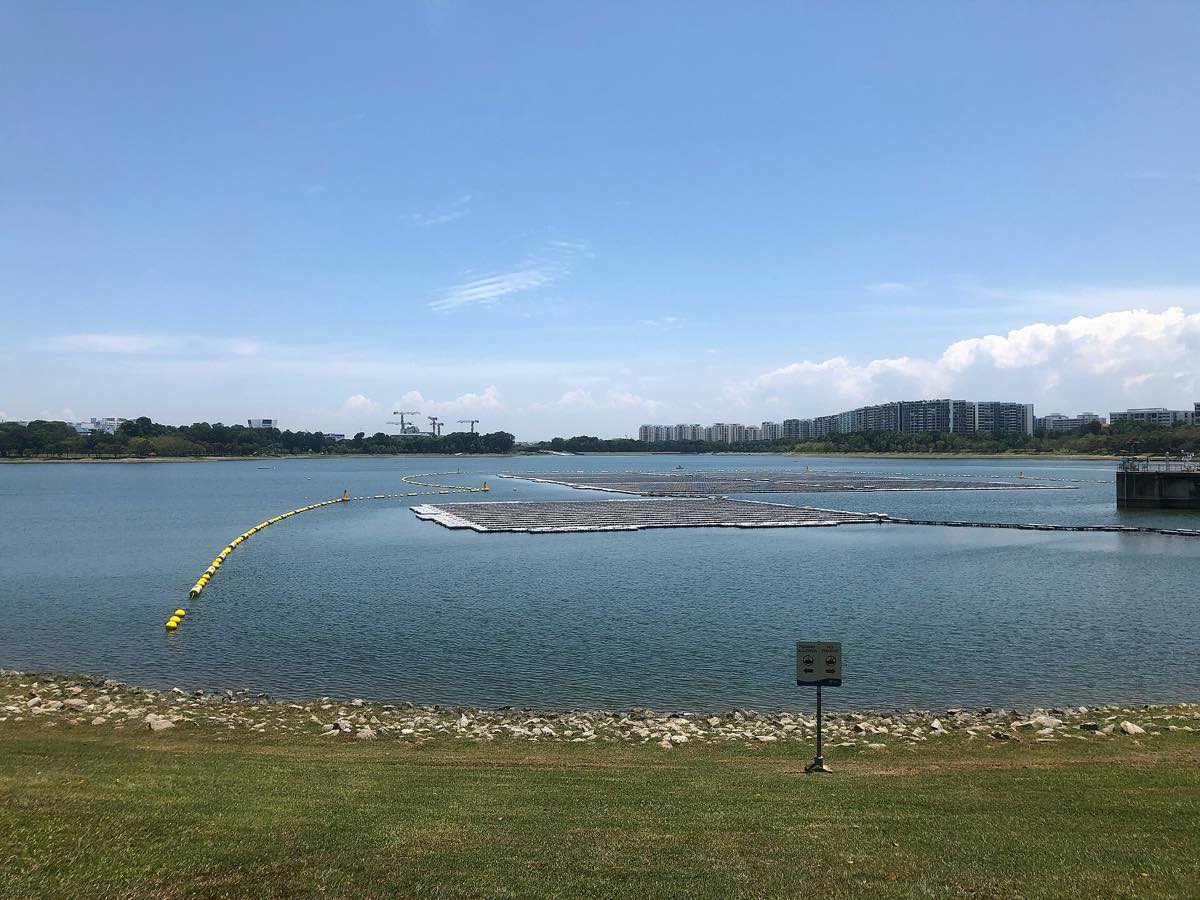
Photovoltaic panels turn light directly into electricity in semiconductor cells. Concentrated solar plants use mirrors to collect heat and drive a generator. Global solar output rose by 636 TWh, or 30%, in 2025 and moved ahead of wind for the first time.[1] Rooftop collectors, common in Türkiye and around the Mediterranean, heat water directly and do not appear in electricity statistics. Systems mounted on reservoirs and at sea are described in Floating Solar Power Plant.
Wind
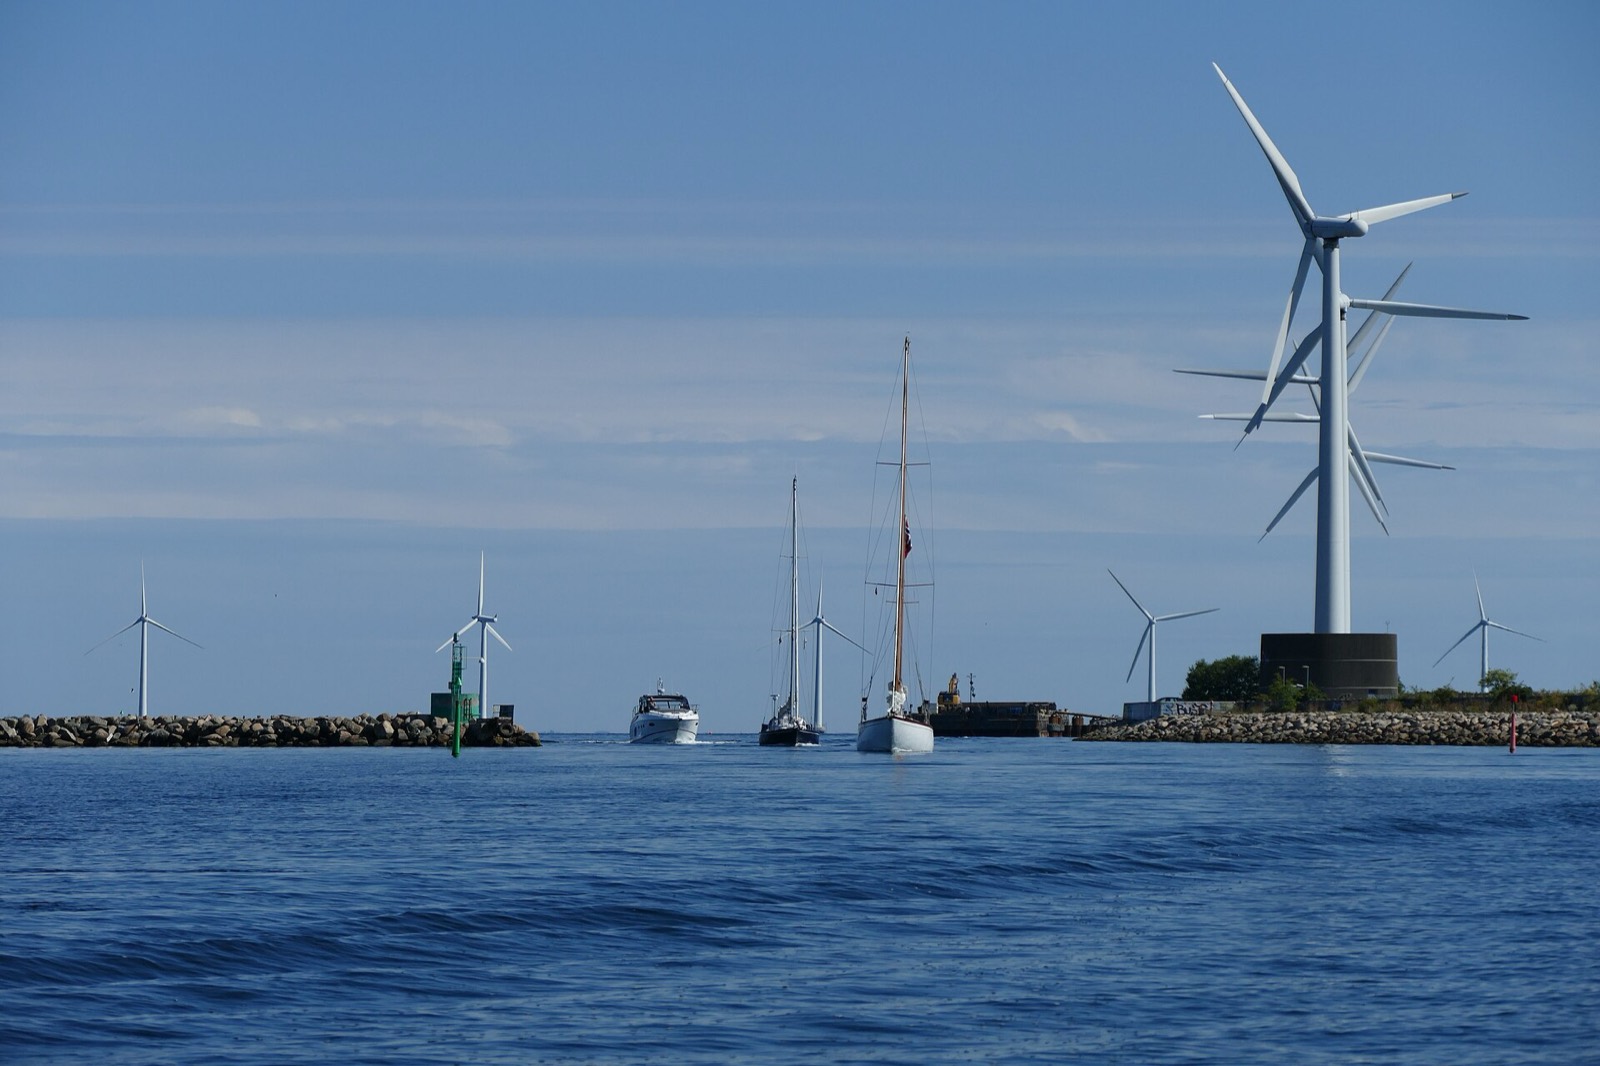
A turbine converts the kinetic energy of moving air into electricity through its blades. The power in the airflow is P = ½ρAv³, where ρ is air density, A the area swept by the blades and v the wind speed. Because power rises with the cube of speed, doubling the wind speed gives eight times the power, which is why siting matters so much. A turbine can extract at most 59.3% of that power, a theoretical ceiling known as the Betz limit. Offshore farms see steadier wind and have created a separate marine sector with its own fleet of vessels.
Hydropower
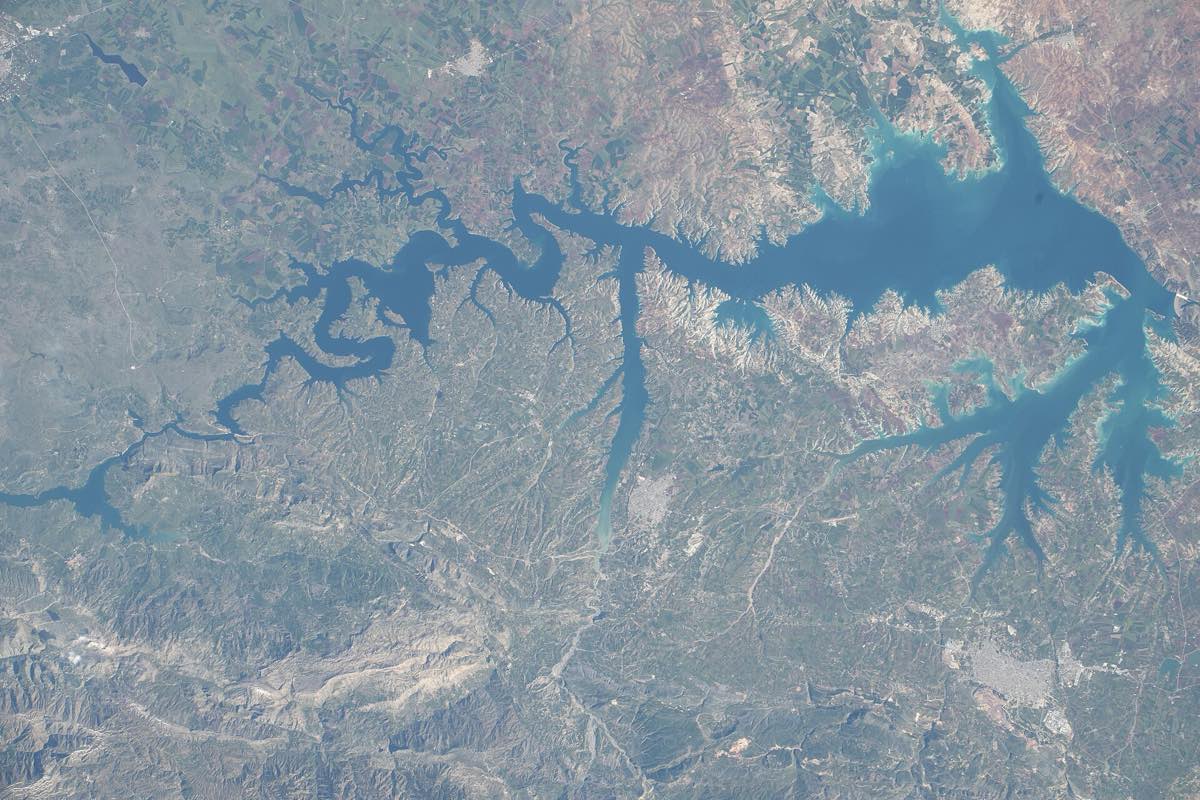
A hydro plant turns the potential energy of water into electricity through a turbine. Output follows P = ρgQHη, with ρ the density of water, g gravity, Q the flow, H the head and η the efficiency. A flow of 100 cubic metres a second falling 100 metres at 90% efficiency gives about 88 MW. Reservoir plants store energy, and pumped storage schemes use surplus power to send water uphill for later use. Output depends on rainfall and drops markedly in dry years.
Geothermal and Marine Energy
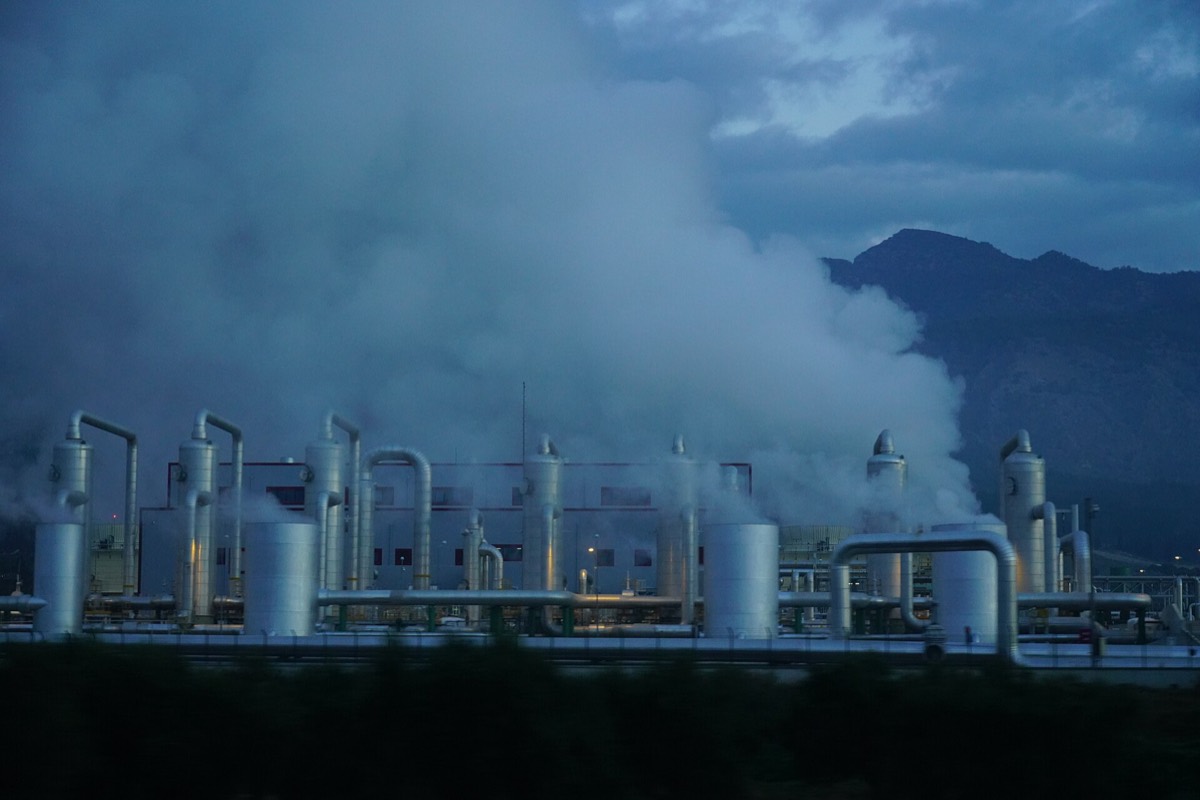
Geothermal plants draw on hot water and steam underground. They run around the clock, so variability is not an issue, but suitable sites are limited. In Türkiye the plants are concentrated in the Aegean region, with Kızıldere the best known. Marine energy from tides and waves remains small, at about 500 MW worldwide.[3]
Biomass and Biofuels
Wood, farm residues, manure and energy crops yield energy when burned or processed. Ethanol comes from sugar cane and maize, biodiesel from vegetable and waste oils, and biogas from organic waste. The source of the feedstock changes the climate sums directly, and land use, water and competition with food remain the main points of dispute.
The Global Target and Progress Against It
At COP28 in 2023, countries pledged to triple renewable capacity to more than 11,000 GW by 2030.[4] Getting there from 5,149 GW at the end of 2025 takes 5,851 GW in five years, or an average of 1,170 GW a year. The record for a single year is the 692 GW of 2025. IRENA's own calculation also puts the required pace above 1,100 GW a year.[4] Deployment is uneven too, with Asia taking 74.2% of new capacity in 2025.[3] Asia is also the one region where coal still outweighs renewables, at 52% against 32% of generation. Clean sources nonetheless met all of the growth in world electricity demand in 2025, and fossil generation stayed roughly flat.[1]
A joint report by IRENA and the International Labour Organization counts 16.6 million jobs in the sector in 2024, of which 44%, or about 7.3 million, are in China.[5]
Renewable Electricity in Türkiye
Ember's review for Türkiye shows wind and solar together overtaking hydropower for the first time in 2025. Drought cut hydro output and coal stayed the largest source.[6]
| Source | Share of 2025 generation |
|---|---|
| Coal | 34% |
| Natural gas | 22% |
| Hydropower | 16% |
| Wind | 11.1% |
| Solar | 10.5% |
Source: Ember, Türkiye Electricity Review 2026.[6] Geothermal, biomass and other sources make up the rest.
The country added 6.5 GW of wind and solar during the year for a total of about 40 GW, and Ember estimates that the 2035 targets require about 8 GW a year.[6] About two thirds of coal generation burns imported coal, so domestic renewables also bear on the energy import bill.
Grid and Material Limits
Wind and solar are variable. Keeping a grid balanced takes storage, flexible generation, transmission and demand management. Those costs do not appear in the plant's own generating cost. They fall on the system as a whole and grow with the share of variable sources. Ember notes that near-flat hydro output has highlighted emerging constraints in balancing fast-growing renewables.[1] Land is a separate question. Output per unit of area is lower than from fossil or nuclear plants, so projects can compete with farmland and natural habitat.
On materials, the sector relies on copper, lithium, silicon and, in some turbine magnets, rare earth elements. Manufacturing is concentrated in a few countries, so the energy security debate now covers equipment supply as well as fuel supply.
The Link with Shipping
Renewable electricity reaches ships in three ways. The first is shore power, which FuelEU Maritime requires of passenger and container ships at major EU ports from 2030.[7] The second is battery ferries on short routes. The third, and for deep-sea ships the most important, is fuel: green hydrogen made with renewable power, and the ammonia, methanol and synthetic fuels derived from it. These remain scarce and expensive, so the deep-sea fleet continues to run mostly on petroleum fuels. Direct use of wind on ships is covered in Sail Assisted Propulsion.
Frequently asked questions
What is renewable energy?
Renewable energy comes from sources that replenish themselves as they are used: sunlight, wind, moving water, the Earth's internal heat and biomass.
Which is the largest source of renewable electricity?
By capacity, solar. By generation, hydropower was long the largest single source, though solar and wind together have now passed it.
Is nuclear energy renewable?
No. It counts as low-carbon, but uranium is a finite ore and nuclear is left out of renewable statistics.
What is a capacity factor?
The ratio of a plant's annual output to what it would produce at full power all year. It explains the gap between capacity and share of generation.
Sources
- Ember. Global Electricity Review 2026, April 2026.
- DieselNet. Summary of the Energy Institute Statistical Review of World Energy 2026.
- International Renewable Energy Agency (IRENA). Press release, April 2026, published by Zawya; SolarQuarter and Ecofin Agency summaries.
- International Energy Agency. COP28 Tripling Renewable Capacity Pledge; PV Tech. IRENA COP30 Renewables Acceleration.
- IRENA and International Labour Organization. Renewable Energy and Jobs: Annual Review 2025.
- Ember. Türkiye Electricity Review 2026, April 2026.
- Baltic Exchange. FuelEU Maritime Regulation.