Liquefied Natural Gas (LNG) and How It Differs from LPG
LNG is natural gas cooled to about −162 °C until it turns liquid. How it differs from LPG and CNG, how it is carried, 2025 trade, Turkish infrastructure and its case as a marine fuel.
LNG, or liquefied natural gas, is natural gas cooled to about −162 °C at close to atmospheric pressure, at which point it becomes a liquid occupying roughly 1/600 of its gaseous volume. It is typically more than 90% methane.[1] LPG, by contrast, consists of propane and butane and liquefies under modest pressure. The distinction is one of molecules first and handling second: methane cannot be liquefied by pressure at ambient temperature, so LNG depends on cold.
That reduction in volume is the commercial basis of the industry, because it lets gas reach markets no pipeline serves. The International Gas Union (IGU) put world LNG trade at 437 million tonnes in 2025.[2] For shipping the product has two roles. It is a cargo carried in specialised tankers, and it is a fuel burned in a growing number of dual-fuel engines.
LNG Compared with LPG and CNG
Compressed natural gas (CNG) is the same gas as LNG, held under high pressure and never liquefied. LNG holds about 2.4 times as much energy per unit of volume,[1] which accounts for its dominance over long sea distances. CNG stays a short-range product.
| Property | LNG | LPG | CNG |
|---|---|---|---|
| Main component | Methane | Propane and butane | Methane |
| Physical state | Liquid at about −162 °C | Liquid under pressure or refrigeration | Pressurised gas |
| Origin | Natural gas | Gas processing and oil refining | Natural gas |
| Vapour relative to air | Lighter once warmed | Heavier | Lighter |
| Main transport | Cryogenic ships and terminals | Cylinders, tanks, gas carriers | Pressure vessels, short range |
The vapour behaviour matters for safety design. LPG vapour sinks and gathers at low points. Cold LNG vapour is initially denser than air and turns buoyant only once it warms above about −110 °C.[3] The separate article on liquefied petroleum gas covers that product in detail.
From Wellhead to Liquid
Raw gas needs treatment before it can be chilled. Carbon dioxide, hydrogen sulphide, water and mercury all have to come out, since they would freeze in the process or attack the aluminium heat exchangers. Heavier hydrocarbons are stripped off as well and often sold separately. The cleaned gas then enters a liquefaction train, where successive refrigeration stages bring it down to −162 °C for storage.
These plants are large, immobile investments, and developers usually secure long-term offtake before committing capital. Capacity is quoted in million tonnes per annum (Mtpa). World liquefaction capacity stood at 524.5 Mtpa at the end of 2025, and final investment decisions covering a further 68.4 Mtpa were taken during that year.[2]
Physical Properties and Hazards
Density runs from about 0.41 to 0.50 kg/L according to composition, temperature and pressure.[1] The liquid is colourless and odourless, and it does not burn as a liquid. It has to vaporise first and then mix with air at roughly 5% to 15% by volume.[1]
A spill boils away and leaves no persistent slick of the kind crude oil forms. The principal hazards lie elsewhere: cold burns, embrittlement of ordinary steel, oxygen displacement in enclosed spaces and ignition of the vapour cloud. Inside a tank, two layers of differing density can form and then mix abruptly, releasing a large volume of vapour and raising pressure fast. This is known as rollover, and the industry body SIGTTO publishes dedicated guidance on preventing it aboard ship.[3]
Several of the worst accidents in the industry's history happened ashore. A tank rupture in Cleveland, Ohio, in 1944 led to a fire that killed 130 people.[1] At Skikda in Algeria on 19 January 2004, a leak of cold hydrocarbon reached a boiler, and the explosion that followed took out three LNG trains and killed more than 20 workers.[4]
Carriage by Sea
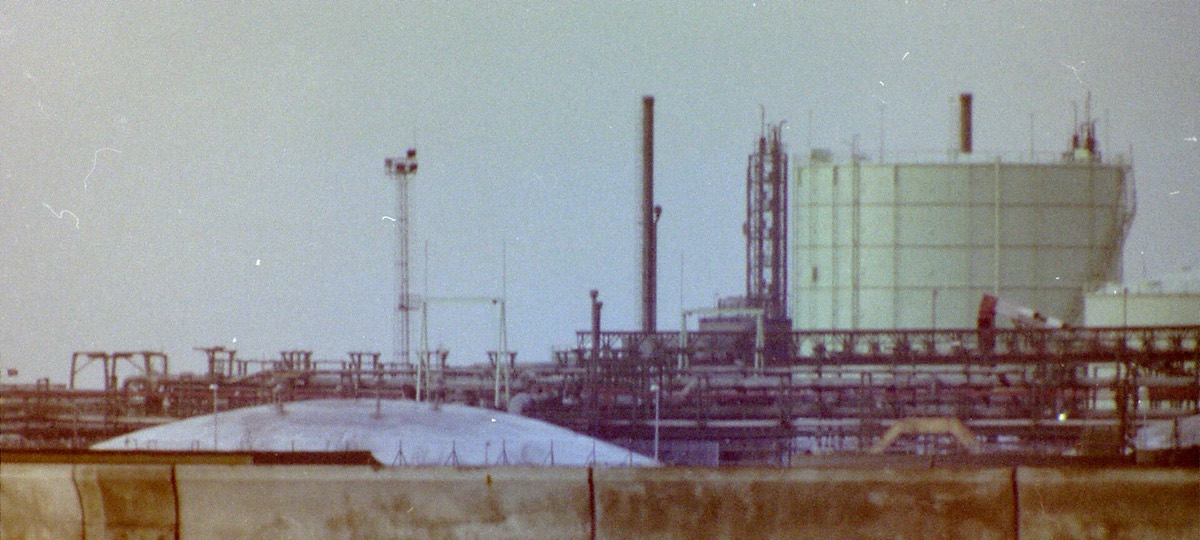
The first ocean cargo sailed aboard the Methane Pioneer, a wartime cargo ship converted in 1958. She left Louisiana on 25 January 1959 and reached Canvey Island in England on 20 February.[5]
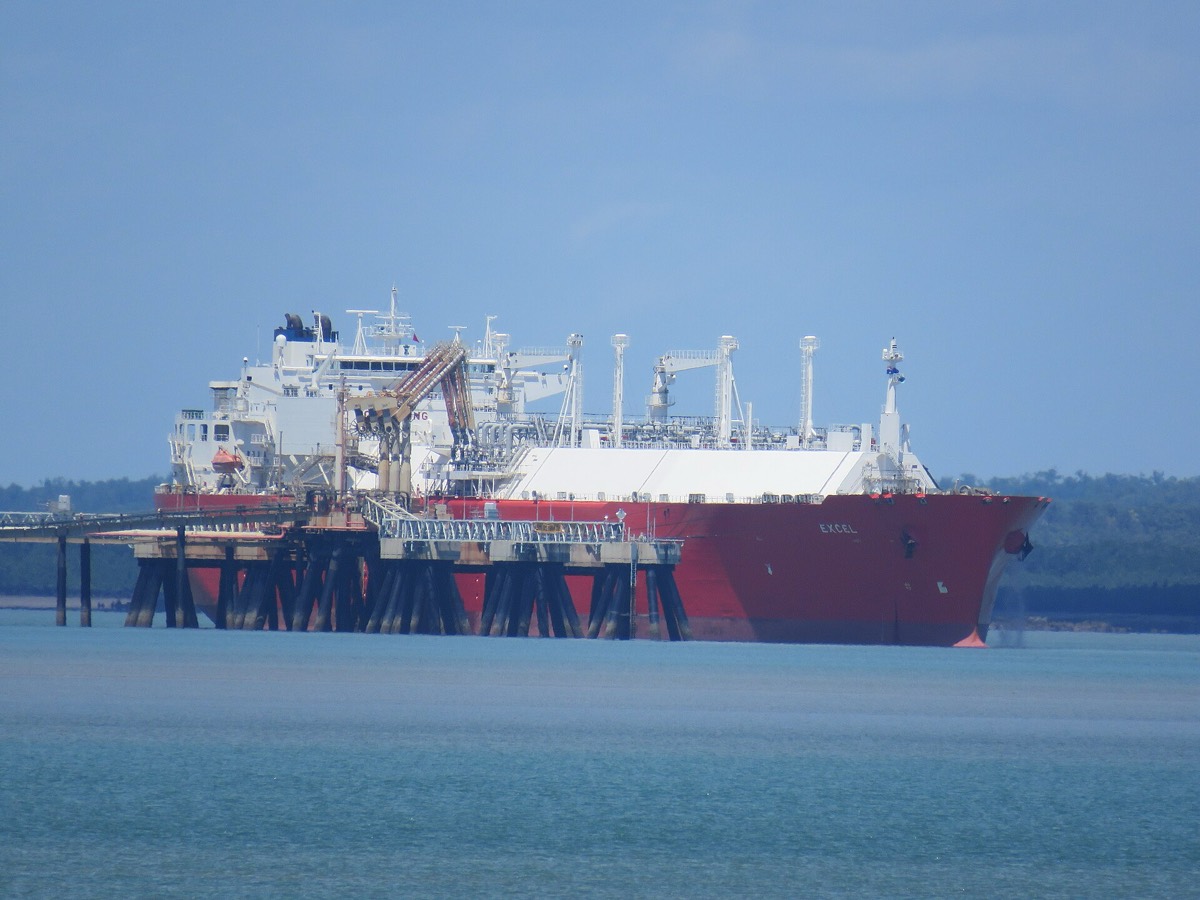
IGU data show 804 active units at the end of 2025, including 49 floating storage and regasification units (FSRUs) and 11 floating storage units. All 79 ships delivered in 2025 fell between 172,600 and 200,000 m³, and 301 more were on order.[6] The largest class, the Q-Max, carries 266,000 m³.[7]
Moss and Membrane Containment
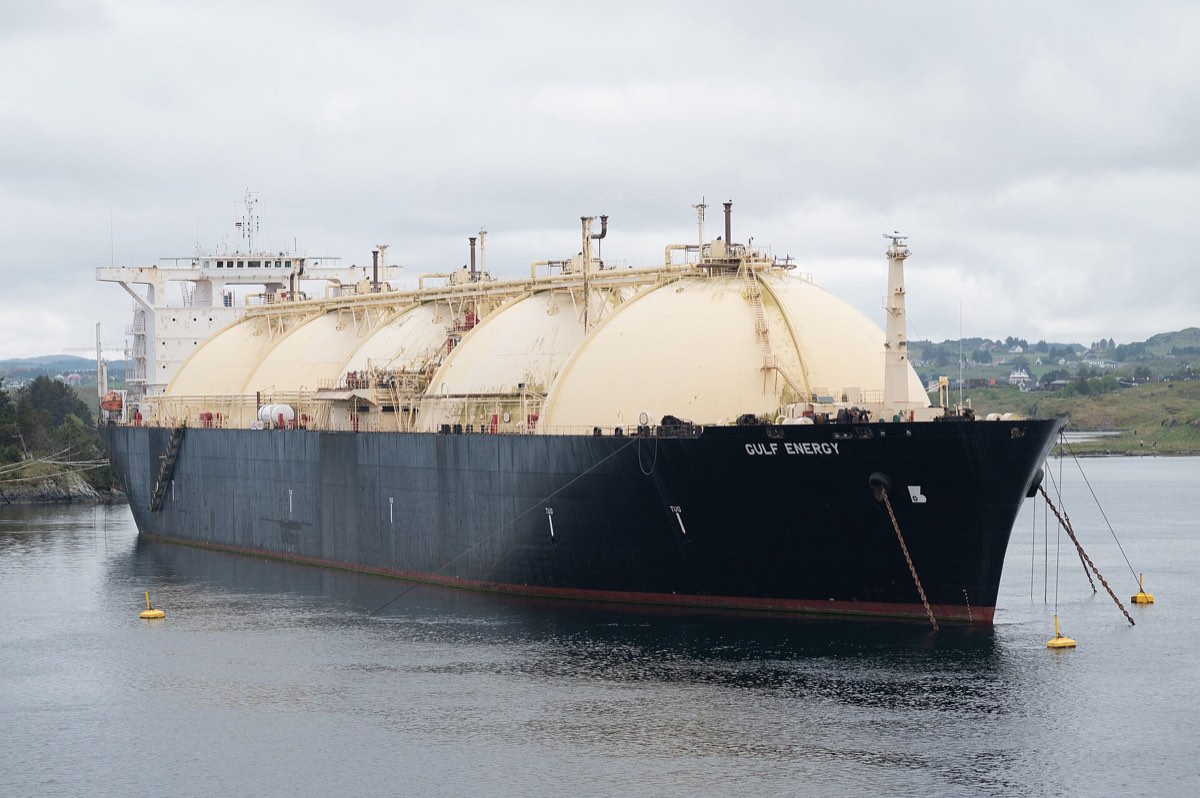
Moss ships carry independent spherical tanks that rise visibly above the deck and fall into the IMO Type B category. Membrane tanks are a different concept: a thin metal barrier and insulation line the inner hull, which takes the cargo load.[7][8] From outside, a membrane ship shows a long trunk deck and no domes.
Boil-Off Gas
No insulation stops heat entirely, so a share of the cargo evaporates during the voyage. Standard ships were long designed for a boil-off rate of 0.15% a day. GTT's Mark III Flex raised insulation thickness from 270 mm to 400 mm and brought the figure to 0.10%.[9] On a ship of 160,000 to 170,000 m³ that difference is about 85 m³, or 36 tonnes, each day.[9] Ships either burn the vapour or reliquefy it.
Receiving Terminals and Regasification
Very little LNG reaches the end user as a liquid. It is pumped ashore into tanks, warmed in vaporisers and sent into the grid, after which power stations, factories and households treat it as ordinary natural gas. Liquid use is confined to sites beyond the network, road transport and ship fuel.
An FSRU performs the same function from a ship's hull. It can be installed faster than a shore terminal and moved if demand changes. The choice between LNG and a pipeline turns on distance, market structure and security of supply. A fixed route to a single buyer favours the pipeline, while a cargo whose destination may change favours LNG.
Contracts and Trading
The industry grew up on long-term sale and purchase agreements. Many include take-or-pay clauses, under which a buyer pays for contracted volumes even when it does not lift them.[10] Delivery terms are equally central: under FOB the buyer provides the ship, under DES the seller does. The logic is explained further under Incoterms.
Figures from the importers' group GIIGNL show 57% of 2025 volume moving under contracts of four years or longer and 43% under spot and short-term deals.[11] The spot market prices against JKM in Asia, TTF in Europe and Henry Hub for US gas, and the spread between them helps determine where a flexible cargo goes.
The Global Market in 2025
Published totals differ. IGU reports 437 million tonnes and GIIGNL 427.9 million, reflecting separate counts, though both describe the same trend: growth of 6.3% and 5.4% respectively.[2][11]
| Indicator (2025) | Value | Source |
|---|---|---|
| World LNG trade | 437 million tonnes | IGU |
| World LNG trade | 427.9 million tonnes | GIIGNL |
| US exports | 110.7 million tonnes | IGU |
| US, Australia and Qatar, share of exports | 63% | GIIGNL |
| Asian imports | 271.0 million tonnes (63%) | GIIGNL |
| European imports | 126.3 million tonnes (30%) | GIIGNL |
| Liquefaction capacity, year end | 524.5 Mtpa | IGU |
Source: IGU; Western Australian government summary of GIIGNL data.[2][11]
Canada and the Mauritania and Senegal project joined the exporters during the year.[2] European imports climbed 29% while Asian imports slipped 4%, mainly because of China.[11][12]
Qatar and the Hormuz Disruption
The market took a severe supply shock in 2026. Output at Ras Laffan and Mesaieed stopped on 2 March after attacks, and QatarEnergy declared force majeure on LNG deliveries two days later. Missile strikes on 18 and 19 March damaged two LNG trains.[13] Qatar supplies about a fifth of the world's LNG, and an estimated 80 million tonnes or more passed through the Strait of Hormuz in 2025.[10]
The damage removed about 12.8 million tonnes a year of capacity, some 17% of Qatari export capability, with repairs estimated at three to five years. Exports recovered in part during September. By mid-October, Kpler expected the month's total to reach no more than about 600,000 tonnes, against 1.6 million in September, as attacks resumed. Reporting dated 2 November 2026 says force majeure had been extended into November for some Asian customers and into December for European ones.[14] The regional context is covered in the article on the Persian Gulf.
LNG Infrastructure in Türkiye
Türkiye has five LNG entry points, made up of two shore terminals and three FSRUs. BOTAŞ operates Marmara Ereğlisi in Tekirdağ together with the Dörtyol and Saros FSRUs, while the EgeGaz shore terminal and the Etki FSRU at Aliağa are privately held.[15][16] National regasification capacity has risen from 34 million m³ a day in 2016 to about 161 million, and two further FSRUs are intended to take it to 200 million.[15]
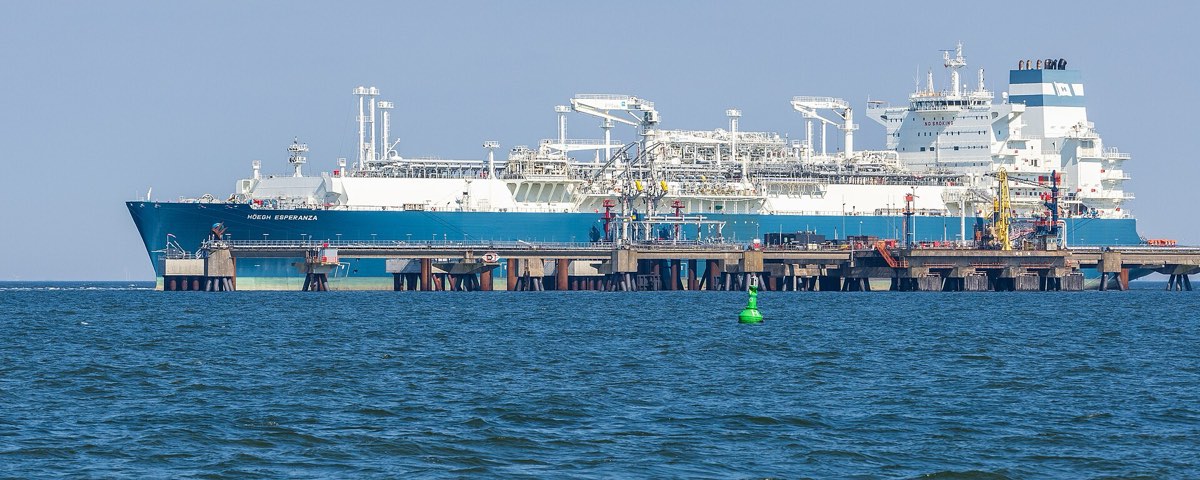
Construction of a fourth tank of 160,000 m³ began at Marmara Ereğlisi on 13 July 2026, which will lift storage from 255,000 to 415,000 m³. The terminal regasifies up to 37 million m³ a day, receives around 65 ships a year and covers about 15% of national gas demand.[15]
The Ertuğrul Gazi FSRU at Dörtyol was reported in 2022 as holding 170,000 m³ with a peak send-out of 28 million m³ a day, while EgeGaz, in service since 2006, was given at 40 million standard m³ a day.[16] During 2024 BOTAŞ also signed supply agreements with Oman, Shell and TotalEnergies and a memorandum with ExxonMobil.[17]
LNG as a Marine Fuel
IMO consumption data show ships of 5,000 GT and above burning 12.9 million tonnes of LNG in 2023, about 6% of a 211 million tonne total.[18] The fleet is growing quickly. DNV counted 914 LNG-capable ships in service and 654 on order in mid-2026, whereas Lloyd's Register reported 1,665 dual-fuel LNG vessels and 982 on order in March 2026. The two counts use different scopes.[19][20] LNG took 63% of the 242 alternative-fuel orders placed in the first eight months of 2026.[21]
Sulphur content is negligible, so a ship in gas mode meets the IMO 2020 limit with no scrubber. Combustion CO₂ is also lower. Using FuelEU Maritime default factors, LNG emits 56.0 g CO₂/MJ against 76.9 g CO₂/MJ for heavy fuel oil.[22]
Upstream emissions and unburned methane erode much of that margin. On a well-to-wake basis the same defaults yield 91.7 g CO₂e/MJ for heavy fuel oil, 89.2 for a medium-speed Otto engine on LNG and 76.1 for a slow-speed Diesel-cycle engine.[22] Engine choice therefore decides most of the climate result, as explained under LNG-fuelled ships. Other options are compared in types of marine fuel.
The Volume Penalty
LNG is rich in energy by mass and poor by volume. At 49.1 MJ/kg and about 0.45 kg/L, a litre holds about 22 MJ. Heavy fuel oil at 40.5 MJ/kg and about 0.99 kg/L holds about 40 MJ, so LNG needs roughly 1.8 times the space for equal energy. The IGF Code then caps filling at 98% at the reference temperature,[8] and insulation and tank geometry add further volume. That is why the 23,000 TEU CMA CGM Jacques Saadé needs an LNG tank of about 18,600 m³.[23]
Bunkering
Three methods exist. Truck-to-ship suits small quantities, shore-to-ship requires a fixed installation, and ship-to-ship, with a bunker vessel alongside, is the route for large parcels. The IGF Code requires systems to be designed so that venting does not occur in normal operation except where safety demands it,[8] which makes tank pressure and vapour return part of every bunker plan.
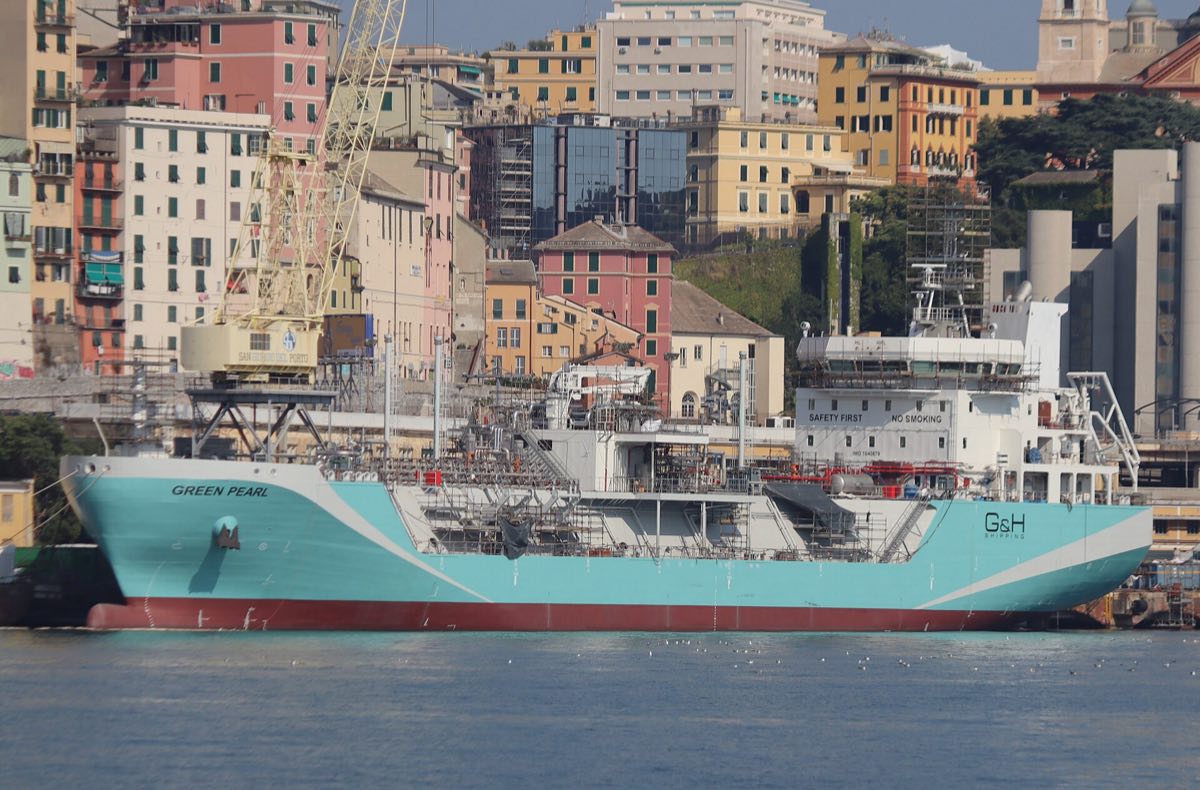
In Türkiye, an October 2025 regulatory change allows wholesale licence holders to sell LNG for ships' fuel use.[24] Bunkerist's petroleum-based products are listed under fuel oil and gas oil.
Frequently asked questions
What is LNG?
LNG is natural gas cooled to about −162 °C at close to atmospheric pressure, at which point it becomes a liquid occupying roughly 1/600 of its gaseous volume.
At what temperature does natural gas liquefy?
About −162 °C at close to atmospheric pressure, with small variation according to composition.
Can LNG explode?
The liquid itself does not burn. The danger arises when evaporated gas mixes with air at about 5% to 15% by volume and meets an ignition source.
What is the difference between LNG and LPG?
LNG is mostly methane kept very cold. LPG is propane and butane, held as a liquid by pressure or milder refrigeration.
Does burning LNG remove a ship's carbon emissions?
No. Combustion still produces CO₂, and the supply chain and methane slip add to the total.
Sources
- Wikipedia. Liquefied Natural Gas (secondary source for density, composition, energy density, flammability and the Cleveland accident).
- International Gas Union (IGU). World LNG Report 2026, press release, July 2026.
- SIGTTO. Guidance for the Prevention of Rollover on LNG Ships; SIGTTO publications on vapour behaviour.
- Wikipedia. Skikda, 2004 LNG plant explosion (secondary source).
- Wikipedia. Methane Pioneer (secondary source).
- PortNews. Summary of fleet data in the World LNG Report 2026, 2026.
- Wikipedia. Gas Carrier (secondary source).
- International Maritime Organization (IMO). Resolution MSC.391(95), IGF Code, 11 June 2015, paragraphs 2.2.31, 3.2.9, 6.4.15, 6.8.1.
- gCaptain. Membrane Containment System Achieves Lower Boil-Off, 10 October 2012.
- DLA Piper. LNG Disputes Emerge after Disruption at Ras Laffan and the Strait of Hormuz, 30 April 2026.
- Government of Western Australia. Western Australia LNG Profile, July 2026 (GIIGNL data).
- Oil & Gas Journal. GIIGNL: US LNG Growth Drives Record Global Trade in 2025, 2026.
- gCaptain; Argus Media. Reports on the QatarEnergy shutdown and force majeure, March 2026.
- Al Majalla. Can China's $3bn Loan to QatarEnergy Revive LNG Exports?, 2 November 2026.
- Daily Sabah. Türkiye Starts LNG Expansion to Boost Marmara Storage Capacity by 60%, 13 July 2026.
- Anadolu Agency. Kara ve Denizdeki LNG Terminalleri Tam Kapasite Çalışıyor, 2 February 2022.
- Memurlar.net. Türkiye'den Doğal Gaz Temininde 100 Milyar Metreküplük LNG Atılımı, 20 September 2024.
- International Maritime Organization (IMO). Report of Fuel Oil Consumption Data, Reporting Year 2023. MEPC 82/6/38, 26 July 2024.
- ENGINE. LNG Leads Shrinking Alternative Fuel Vessel Orderbook in June: DNV, 3 July 2026.
- LNG Industry. Lloyd's Register Fuel for Thought: LNG, 6 May 2026.
- LNG Industry. DNV Alternative Fuel Vessel Order Figures for August 2026, 4 September 2026.
- European Commission. Guidance on the FuelEU Maritime Regulation for Shipping Companies, 8 October 2025; Regulation (EU) 2023/1805, Annexes I and II.
- Wikipedia. CMA CGM Jacques Saadé (secondary source).
- Memurlar.net. Türkiye Enerjide Lig Atlıyor, 11 October 2025.